
The energy landscape has undergone a seismic shift over the past two decades, with solar, wind, and battery storage seeing dramatic cost reductions, while nuclear and LNG face stagnation and volatility. In Australia, the debate over nuclear versus renewables and battery storage has intensified, with policymakers and industry leaders weighing the feasibility, cost, and deployment speed of each option. Below, we break down the trends in LCOE—the key metric for comparing the cost-effectiveness of different power generation sources—and what they mean for Australia’s energy future.
What is LCOE and why does it matter?
LCOE stands for Levelized Cost of Energy, a key metric used to compare the cost of producing electricity from different energy sources over their full lifecycle. It represents the average cost per unit of electricity—typically measured in $/MWh or cents/kWh—accounting for all the expenses involved: construction, operation and maintenance, fuel (if applicable), and financing, spread out over the system’s lifetime and total energy output. LCOE allows for a true apples-to-apples comparison between technologies like solar, wind, coal, gas, and nuclear. The lower the LCOE, the cheaper and more competitive the energy source—making it an essential benchmark in understanding the evolving economics of the global energy transition.
LCOE Trends by Energy Source (2005–2025)
Solar Energy ☀️
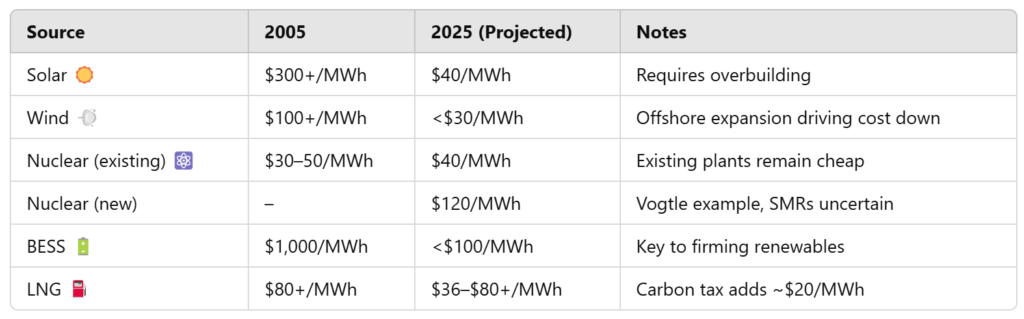
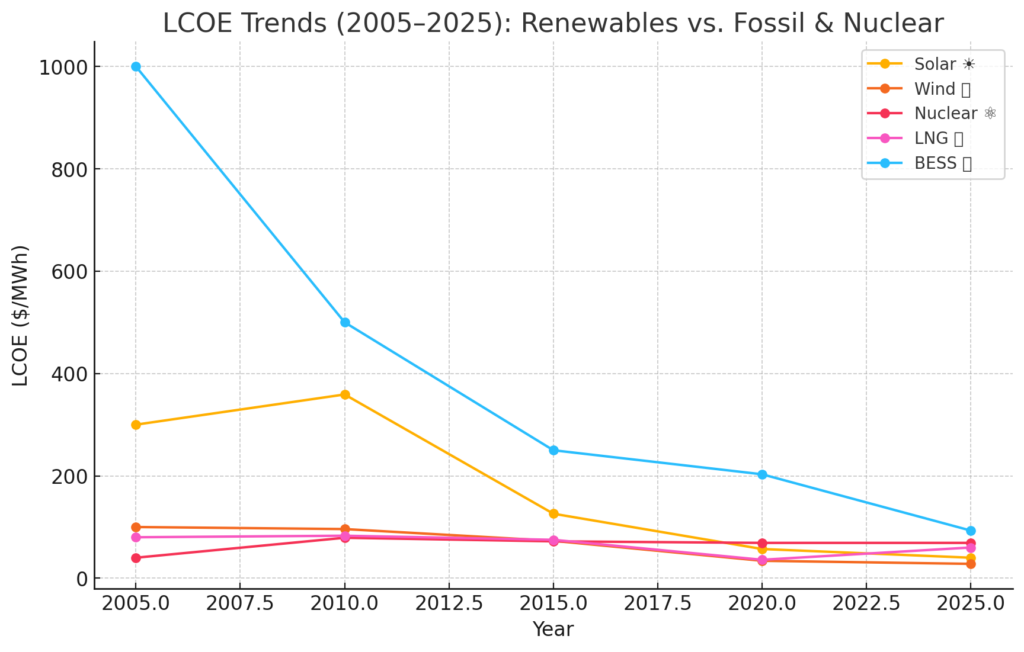
- 2005: ~$300+/MWh – Prohibitively expensive, mostly limited to niche applications.
- 2010: ~$359/MWh – Early cost declines but still costly compared to fossil fuels.
- 2015: ~$126/MWh – Rapid scaling, driven by cheaper panels and improved efficiency.
- 2020: ~$57/MWh – Achieves mainstream competitiveness with fossil fuels.
- 2025 (Projected): ~$40/MWh – Continues to fall as technology advances and scale increases.
🟢 Key Takeaway: Solar has seen an over 85% cost reduction since 2010, making it one of the cheapest power sources globally. However, with a ~20% capacity factor, solar requires overbuilding compared to nuclear (~90% capacity factor). This is why Australia has invested heavily in battery storage to firm renewables.
Wind Energy 💨
- 2005: ~$100+/MWh – Early-stage deployment, high installation costs.
- 2010: ~$96/MWh – Marginal improvements but still expensive.
- 2015: ~$73/MWh – Larger turbines and better designs lead to steady reductions.
- 2020: ~$34/MWh – Becomes one of the most affordable energy sources.
- 2025 (Projected): <$30/MWh – Expected to continue declining due to offshore expansion.
🟢 Key Takeaway: Wind has seen an over 70% cost reduction, making it one of the most economical and scalable renewables. Australia’s vast land and coastal resources make it an ideal location for both onshore and offshore wind farms.
Nuclear Energy ⚛️
- 2005: $30–$50/MWh – Existing reactors provide low-cost power.
- 2010: $79/MWh – Rising capital costs for new plants.
- 2015: $72/MWh – Minimal improvements, plagued by high construction expenses.
- 2020: $69/MWh – Cost stagnation due to regulatory delays and overruns.
- 2025 (Projected): ~$69/MWh – Existing plants remain competitive, but new builds struggle with long timelines and cost overruns (e.g., Vogtle’s $120/MWh after 15+ years of delays). Small Modular Reactors (SMRs) such as NuScale ($89/MWh estimate by 2029) or Rolls-Royce (UK, delayed to 2030+) may alter this, but adoption is slow and uncertain.
🟠 Key Takeaway: Existing nuclear is cheap, but new plants remain costly and delayed. Extending lifespans requires upgrades ($45–$70/MWh), and SMRs face high upfront costs and regulatory hurdles. In Australia, nuclear remains politically contentious, with no established regulatory framework or infrastructure to support deployment before 2040.
Battery Energy Storage (BESS) 🔋
- 2005: ~$1,000/MWh – High costs due to early-stage lithium-ion technology.
- 2010: ~$500–800/MWh – Costs begin falling as battery R&D scales up.
- 2015: ~$250/MWh – Cost drops accelerate, supporting renewables growth.
- 2020: ~$203/MWh – Lithium-ion dominance, global supply chains improve efficiency.
- 2025 (Projected): ~$93/MWh – Costs expected to fall below $100/MWh, making grid-scale storage competitive.
🔵 Key Note: LCOS (Levelized Cost of Storage) measures storage economics, factoring in cycles, degradation, and efficiency losses.
🟢 Key Takeaway: Battery storage costs have dropped nearly 90% in two decades, enabling firmed renewables to replace fossil fuels. Australia’s grid-scale battery projects, such as the Victorian Big Battery and Hornsdale Power Reserve, are already demonstrating how battery storage can provide grid stability without nuclear.
Liquefied Natural Gas (LNG) Power ⛽
- 2005: ~$80+/MWh – Expensive due to infrastructure and fuel costs.
- 2010: ~$83/MWh – Prices stable but dependent on gas markets.
- 2015: ~$75/MWh – Fracking boom in the US lowers costs.
- 2020: ~$36/MWh – COVID-19 causes temporary low gas prices.
- 2025 (Projected): $36–$80+/MWh – Highly variable, hinging on Europe’s gas demand, U.S. export capacity, and Asian spot prices. A $50/tonne carbon tax could add ~$20/MWh to LNG’s LCOE, while EU methane penalties may add another $5–10/MWh, further eroding its competitiveness against renewables.
🟠 Key Takeaway: LNG is cheaper than nuclear but highly volatile, as fuel prices fluctuate due to geopolitical and economic factors. Future competitiveness hinges on carbon pricing and global LNG demand.
LCOE Comparisons (2005 vs. 2025)
Policy Impact in Australia
- Renewables Boom: Australia has among the highest rooftop solar penetration rates in the world, and large-scale solar and wind projects continue to expand.
- Grid-Scale Batteries: Projects like the Victorian Big Battery and Hornsdale Power Reserve are proving that battery storage can support renewables.
- Nuclear Policy Challenges: Despite political advocacy for nuclear, Australia’s legislative bans and lack of infrastructure make near-term nuclear deployment unlikely.
- LNG’s Role: Australia remains a major LNG exporter, but global demand shifts and carbon pricing could reduce its long-term viability.
Final Thoughts: The Energy Cost Trajectory
The rapid decline in the cost of solar, wind, and battery energy storage follows a classic S-curve adoption pattern, where technological improvements and economies of scale drive exponential price reductions. With the momentum we’ve seen in cost declines, it is likely that by 2030, the cost of renewables and BESS could halve from 2025 levels, making them even more dominant in both Australia and the global energy landscape.
Meanwhile, nuclear and LNG remain stagnant, weighed down by high capital costs, long construction timelines, and volatile fuel prices. Private equity and major investors recognize this—billions are flowing into renewables and large-scale battery projects, while nuclear is largely ignored due to long payback periods and sunk cost risks. The record number of renewable and BESS projects being commissioned and installed today further reinforces that the market sees firmed renewables as the future—not nuclear or gas.
Call to Action: The Future of Australia’s Energy Grid
💡 Solar and wind have already won on cost. The real question is whether batteries and grids can scale fast enough to phase out fossils—and if nuclear can survive long enough to matter in Australia.
With costs plummeting, is nuclear still viable in Australia? Should Australia continue investing in grid-scale batteries over nuclear? Drop your thoughts below!