
???? 30-Second Takeaway:
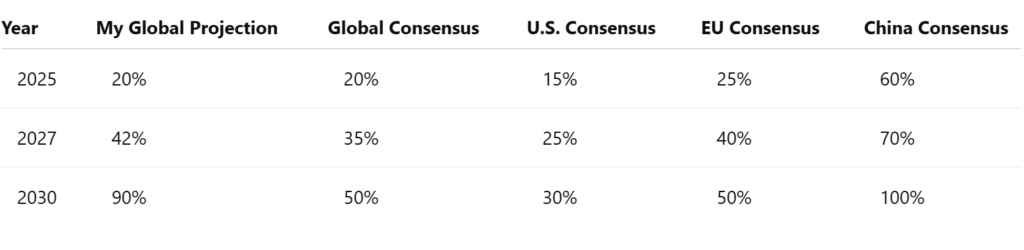
- BEVs will hit 90% of global car sales by 2030 (down from 95% due to U.S. policy shifts)
- China leads (100%), Europe follows (85%+), U.S. lags (75%)
- 3 key drivers: Battery cost plunge, ICE supply chains collapse, renewable energy synergy
- Biggest risk: Charging infrastructure gaps in emerging markets
What if I told you that even with political setbacks, EVs will dominate car sales by 2030? That’s right—despite recent challenges, the road to mass BEV adoption is still clear. Back in 2019, I projected that global BEV (Battery Electric Vehicle) sales would reach between 90-95% of total vehicle sales by 2030. This forecast was based on several critical factors: technological improvements, cost reductions, increasing consumer acceptance, and strong policy support from major economies.
However, as we move into 2025, new developments have prompted a reassessment of these projections. While my 2024 forecast was accurate—missing the actual NEV (New Energy Vehicle) final sales figure by just 100,000 units—I have now factored in the ‘Trump effect’ when updating my 2025-2030 outlook.
The ‘Trump Effect’: Why It Matters
The ‘Trump effect’—including a 25% tariff on imported EV batteries, reduced federal tax credits, and emissions regulation rollbacks—could raise U.S. EV prices by 10% and slow sales growth by 5%. As the U.S. remains a major automotive market, this impacts global adoption, lowering my projection from 95% to 90% by 2030. However, state initiatives like California’s zero-emission mandates and New York’s infrastructure investments may mitigate these setbacks. Local policies can counteract federal headwinds, keeping the BEV transition on track.
Despite the potential challenges posed by the ‘Trump effect’, strong consumer demand, rapid battery innovation, and international momentum for EV adoption persist. Europe and Asia are doubling down on their commitments to electric mobility, driven by emissions regulations and aggressive electrification targets.
Why the BEV Revolution Is Still on Track
Technological advancements continue to lower the cost of ownership, with new battery technologies like LFP and sodium-ion promising even greater affordability and efficiency. Recent insights from ARK Invest suggest that EV adoption is surpassing traditional S-curve dynamics, indicating a more rapid and expansive growth trajectory. As battery costs decline, EVs become accessible to new consumer segments, sparking fresh waves of adoption. ARK’s analysis highlights that, rather than plateauing, EV adoption is accelerating, driven by overlapping adoption cycles as cost reductions make BEVs increasingly attractive to budget-conscious buyers. According to BloombergNEF, battery costs have fallen from $132/kWh in 2022 to $89/kWh today, with LFP batteries already at $50/kWh in China. Coupled with 500KW global fast chargers expected by 2025 (IEA), the cost and convenience of BEVs are set to dominate new car sales.
Emerging markets like Latin America, India, and Africa face challenges with charging infrastructure, but affordable EVs from brands like BYD and sodium-ion battery tech offer potential solutions. A major driving force here is the desire of everyday people to break free from oil dependency and escape the cycle of petrol price gouging. The economic motivation for energy independence is especially strong in developing regions, where fuel costs can take a significant portion of household income. By transitioning to cheap renewables and EVs, these communities can reduce reliance on volatile oil, coal and gas markets, making electric mobility not just a technological shift but a social and economic liberation. These regions, with their growing demand and focus on cost-effective solutions, could have an edge in reaching 90% adoption by 2030 if infrastructure gaps are addressed.
My Projections vs. Consensus
While the consensus often lands around 50% BEV sales by 2030, I project 90% based on the S-curve formula used to model adoption in Norway, Denmark, and Sweden. Key factors include battery cost reductions, technological advancements, and the collapse of ICE supply chains. I also foresee that from 2027 onwards, global PHEV sales will begin collapsing. PHEVs have long been viewed as a transitional technology—providing a safety net for those wary of limited range or charging availability. However, advancements in battery density, particularly with LFP and sodium-ion technologies, are rapidly making PHEVs obsolete. As costs drop and range extends, the onboard petrol generator loses its appeal, especially when BEVs offer lower maintenance, running costs, and a simpler powertrain.
From 2027 to 2030, the growth of BEVs will be exceptionally strong for several reasons. First, the maturity of next-gen battery technologies will push prices well below parity with ICE vehicles, making BEVs the obvious financial choice. Second, legacy automakers, facing increasing pressure to electrify, will accelerate their BEV lineups while phasing out hybrids. Lastly, consumer preferences will continue to shift toward pure electric as charging networks expand and EV infrastructure becomes more ubiquitous, reinforcing the idea that hybrids were merely a temporary stepping stone. I wrote more in depth on this subject in Why PHEVs Are Losing Their Shine.
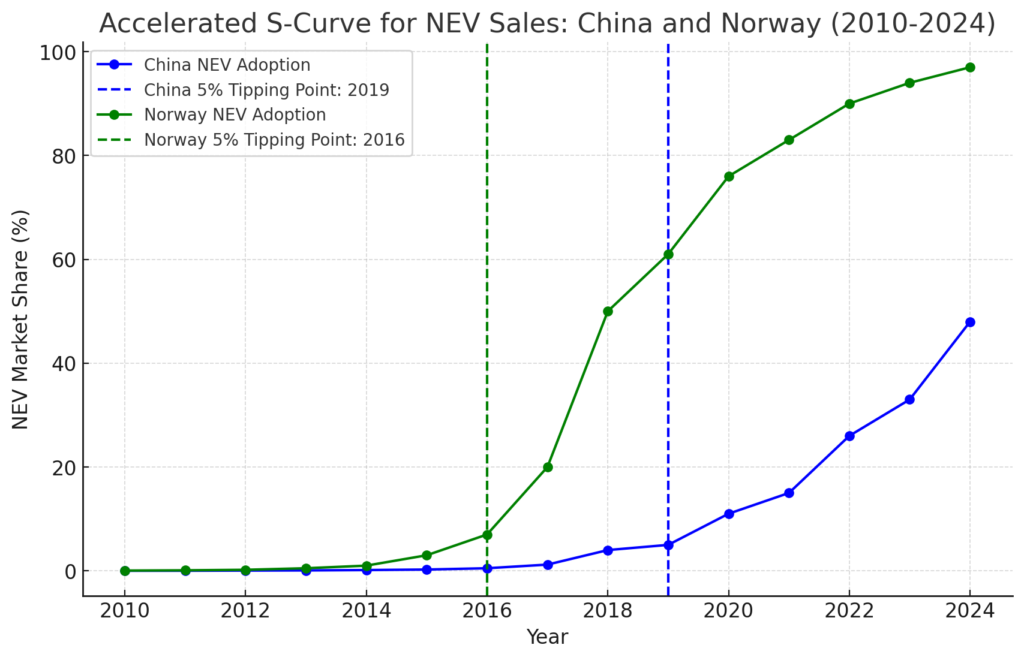
S-Curve vs. Linear Growth: Visual Comparison
The following chart compares the adoption curves of New Energy Vehicles (NEVs) in China and Norway from 2010 to 2024, highlighting the accelerated S-curve pattern once the 5% tipping point is surpassed. Including NEVs, rather than just BEVs, is essential here, for several reasons:
- Reflecting Market Reality:
- In both China and Norway, the transition to electrification involves a combination of BEVs, PHEVs (Plug-in Hybrid Electric Vehicles), and EREVs (Extended-Range Electric Vehicles).
- Ignoring PHEVs and EREVs would underrepresent the actual shift towards cleaner transportation, especially in markets where these hybrid forms still play a significant role.
- Capturing Policy Impact:
- In China, government incentives have historically favored a broad category of NEVs, not just pure BEVs. Including all NEVs accurately reflects the policy-driven adoption patterns and consumer responses.
- Similarly, in Norway, the early years of electrification saw substantial contributions from PHEVs before BEVs became dominant.
- Transition Dynamics:
- The shift from ICE to electric often follows a phased approach where PHEVs act as a transitional technology. Including them in the adoption curve shows how mixed technology adoption precedes the full commitment to BEVs.
- Excluding NEVs would make the curve appear artificially slow in the early stages, missing the gradual buildup that led to the later acceleration.
- Global Comparability:
- As different regions progress at different rates, focusing solely on BEVs could make the comparison misleading. NEVs offer a more holistic view of how electrification unfolds across diverse markets.
- Consumer Choice and Practicality:
- In many regions, PHEVs are still seen as a practical stepping stone for drivers transitioning from ICE to fully electric. By including all NEVs, the graph better represents consumer behavior and market adaptation.
Bottom Line:
The inclusion of NEVs provides a comprehensive view of the electrification process, showing how diverse technologies collectively drive the market shift. It highlights that the S-curve acceleration does not just depend on pure electric models but on the entire spectrum of new energy vehicles, which is particularly relevant when analysing both mature and emerging markets.
Risks and Wildcards
TThe road to 90% BEV adoption by 2030 isn’t without challenges and opportunities.
Upside:
- Breakthroughs in Solid-State Batteries: If these become commercially viable, they could dramatically boost range, reduce charging times, and lower costs, accelerating BEV adoption.
- Oil Price Spikes: A sudden rise in oil prices could make ICE vehicles economically unviable, pushing consumers toward electric options faster than anticipated.
- Autonomous Ride-Hailing Adoption: If autonomous BEV fleets become mainstream, it would drastically increase BEV utilization, making shared electric mobility a dominant model.
Downside:
- Lithium Processing Bottlenecks: While mining capacity is ramping up, the ability to convert raw lithium into battery-grade material is lagging, especially outside China. This processing gap could create temporary shortages despite an overall raw material surplus.
- Lithium Shortages: If demand from EVs and battery storage systems (BESS) continues to surge, supply bottlenecks may reemerge, especially if new mining and processing projects face delays.
- Legacy Automaker Bankruptcies: If major traditional carmakers fail to adapt, their collapse could disrupt supply chains, indirectly affecting BEV production.
- Regulatory Uncertainty: Shifts in policy, especially in key markets like the U.S. or Europe, could either accelerate or stall adoption depending on the political climate.
- Geopolitical Tensions: Trade wars or conflicts impacting raw material sourcing, like lithium or cobalt, could create unexpected setbacks.
In this fast-evolving landscape, staying adaptable and anticipating both risks and breakthroughs is crucial for navigating the path to widespread BEV adoption.
Conclusion
Despite policy challenges, my analysis shows that global BEV adoption is on track to reach 90% by 2030. Falling battery costs, integration with renewable energy, and rising consumer demand are driving this transition. Automakers’ ability to adapt and expand charging infrastructure will be critical for sustaining momentum.
While 90% BEV sales by 2030 may seem ambitious to some, the convergence of economic, technological, and social factors makes it increasingly plausible. It’s bold, but it’s not baseless optimism. Policy shifts and market dynamics will undoubtedly shape the journey, but the path to a predominantly electric future appears strong and well-established. The so-called “Trump Effect” may create temporary obstacles, but it remains just a small bump on the road to transition.
