
The quantitative backbone of the Bettrification thesis — cost curves, scale effects, and system-level phase change.
This document provides concise, non‑dense explanations for each table and chart used on the Bettrification Engine Data page. Each block is designed to sit directly under its corresponding visual to prevent misinterpretation without adding narrative clutter.
Engine Index (Jump to Section)
- Battery Cost Collapse → NEV Adoption
- BESS vs BTM Storage
- Solar, Wind & Storage Scaling
- Cost Curves Are Gravity
- BESS Costs vs Additions
- Wind Cost vs Deployment
- Solar Cost vs Deployment
- Grid Storage Coverage
- Central BESS vs Distributed FLEX
- Growth of Distributed FLEX
- Energy System Growth Curves
- Curtailment & Abundance Management
- System Additions & Storage Balance
- Distributed Storage & Dispatchable Availability
- Distributed Energy & Storage (BTM)
- Global Energy Cost Curves
- ICE vs NEV Sales Share
- NEV Fleet & Battery Size
- Car Sales by Powertrain
- Market Share & Battery Stock
- Common Terms Used Across Tables
1. Battery Cost Collapse vs NEV Adoption (2016–2035)
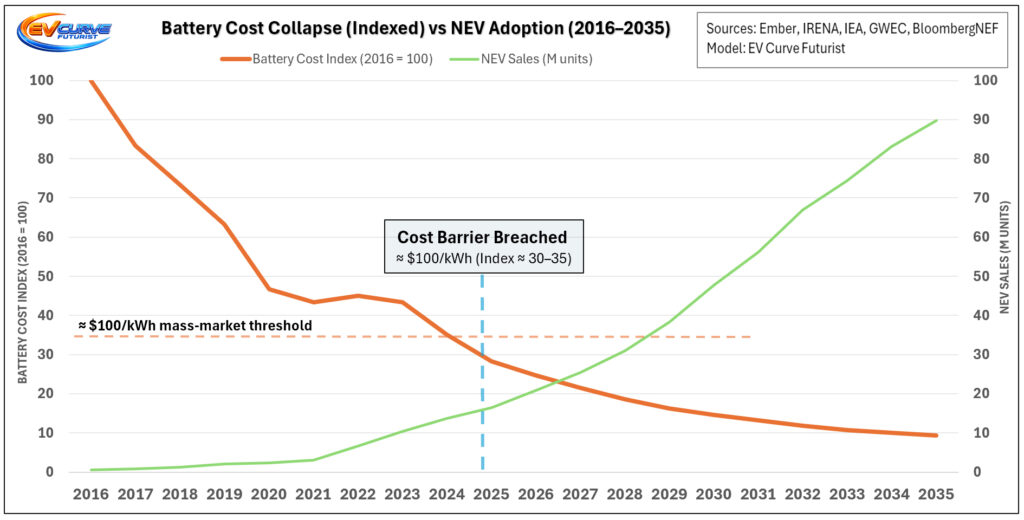
What this shows
- Battery costs fall first; NEV adoption accelerates after key cost thresholds are crossed.
Key terms
- NEV – New Energy Vehicles (BEV + PHEV)
- $/kWh – Battery pack cost at system level
- <$100/kWh – Widely regarded mass‑market cost parity threshold
2. BESS vs BTM: Two Storage Curves, One System Shift (2016–2035)
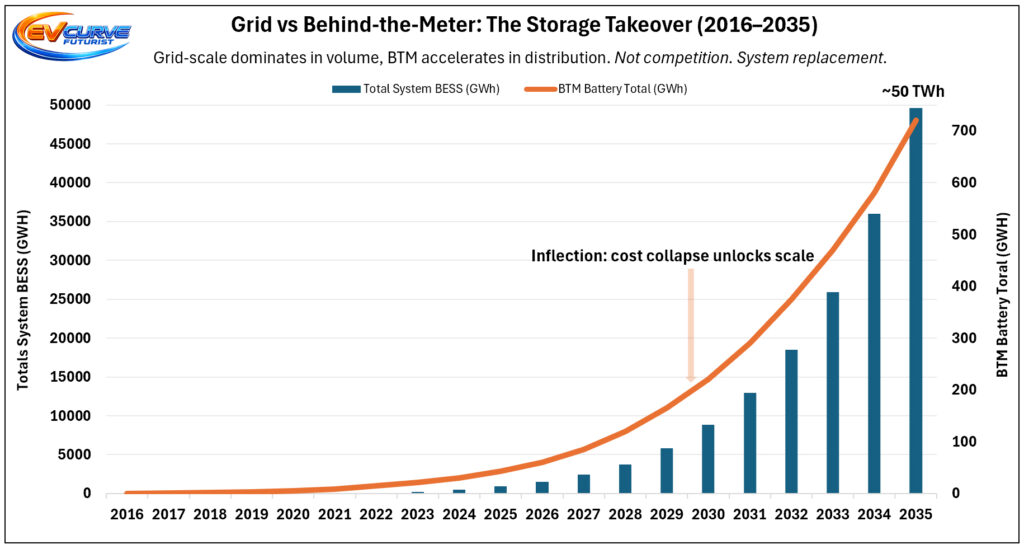
What this shows
- Grid‑scale and behind‑the‑meter storage scale together but serve different system roles.
Key terms
- BESS – Grid‑scale Battery Energy Storage Systems
- BTM – Behind‑the‑meter batteries (residential + commercial)
- GWh – Energy capacity (not power)
3. Solar, Wind & Storage Scale Together (2016–2035)

What this shows
- Storage scales alongside variable generation, enabling higher renewable penetration.
Key terms
- TWh – Annual energy generated
- GWh (BESS) – Installed storage energy capacity
- GW – Installed power capacity
4. Cost Curves Are Gravity
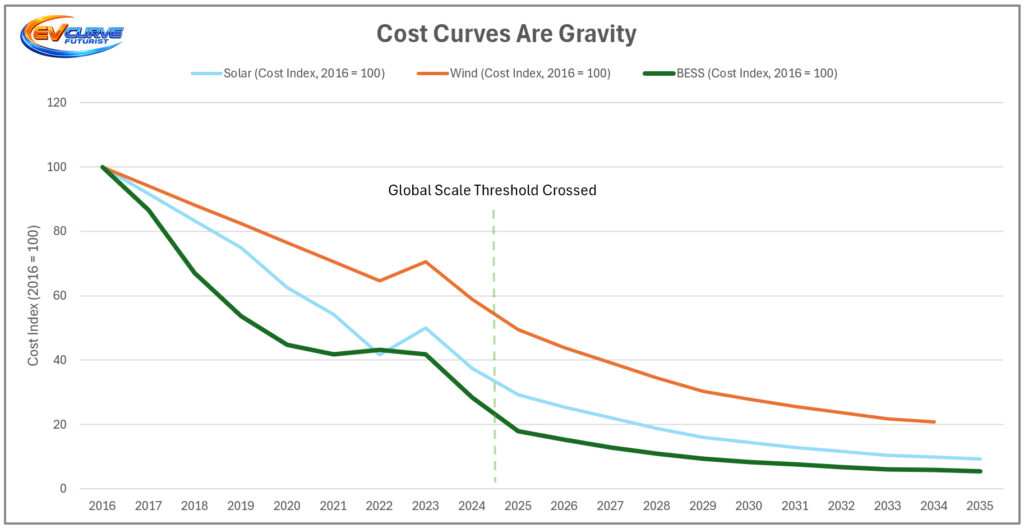
What this shows
- Declining costs pull deployment forward regardless of policy or ideology.
Key terms
- Cost Index (2016 = 100) – Normalised cost comparison
- LCOE – Levelised Cost of Energy
- Scale threshold – Point where deployment becomes self‑reinforcing
5. BESS Costs vs Grid Storage Additions (2016–2035)
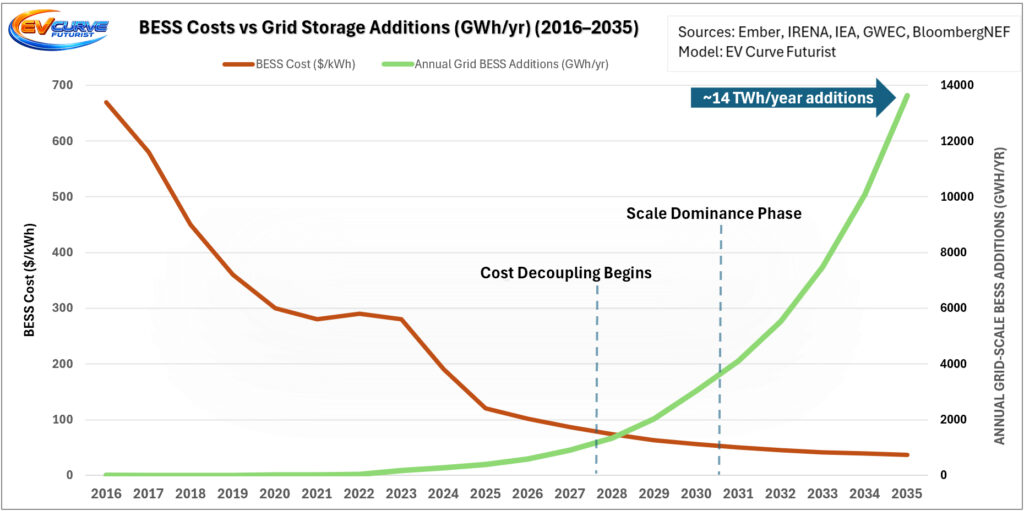
What this shows
- Falling storage costs unlock exponential growth in grid‑scale deployments.
Key terms
- $/kWh (BESS) – Installed grid storage cost
- GWh/yr – Annual grid‑scale storage additions
- Grid BESS – Centrally dispatched storage assets
6. Wind Costs vs Wind Deployment (2016–2035)

What this shows
- Lower wind costs correlate with rapid growth in cumulative generation.
Key terms
- Cumulative TWh – Total wind energy generated over time
- $/MWh – Utility‑scale wind LCOE
- Deployment – Actual energy delivered, not nameplate capacity
7. Solar Costs vs Solar Deployment (2016–2035)

What this shows
- Solar deployment accelerates as costs fall, reinforcing learning curves.
Key terms
- Cumulative TWh – Total solar energy generated
- $/MWh – Utility‑scale solar LCOE
- Learning rate – Cost decline driven by scale and manufacturing experience
8. Grid Storage Coverage of Renewable Output (hrs equivalent)

What this shows
- Grid storage evolves from seconds to multi‑hour coverage of renewable output.
Key terms
- Hours equivalent – Storage energy divided by average renewable output
- Multi‑hour storage – Threshold where storage materially reshapes grid operation
- Coverage – Energy buffering, not full system backup
9. Central BESS vs Distributed FLEX (GWh)

What this shows
- Centralised storage dominates early; distributed flexibility grows in parallel.
Key terms
- Distributed FLEX – Dispatchable energy from homes, businesses, and EVs
- Central BESS – Utility‑scale storage assets
- Installed energy – Total available stored energy
10. Growth of Distributed FLEX (GWh)

What this shows
- Distributed flexibility becomes a meaningful system resource as participation scales.
Key terms
- Distributed FLEX – Collective term for dispatchable energy from BTM, C&I, and EV sources (see Chart 14).
- V2G / VPP – Vehicle-to-Grid / Virtual Power Plant
- Dispatchable – Energy available when required by the grid
11. Energy System Growth Curves — Solar, Wind & BESS

What this shows
- Solar, wind, and storage follow different growth profiles but converge into a single system transition.
Key terms
- GW – Installed power capacity
- YoY % – Year‑over‑year growth rate
- BESS → GWh – Installed storage energy capacity
12. Renewable Curtailment & Abundance Management

What this shows
- Curtailment rises as renewables scale, then stabilises as storage absorbs excess energy.
Key terms
- Curtailment (%) – Share of renewable output not immediately used
- Delivered (TWh) – Net energy reaching the grid
- Abundance management – Monetising surplus energy via storage and flexibility
13. Global Energy System Additions & Storage Balance (2016–2035)


What this shows
- Generation growth and storage depth evolve together toward multi‑hour grid resilience.
Key terms
- BESS Duration (hrs) – Fleet‑average effective storage depth
- Capacity Factor (CF) – Actual output vs theoretical maximum
- Storage (hrs) – Storage‑to‑renewable output ratio
14. Distributed Storage & FLEX: Dispatchable Availability (BTM + C&I + EV)


What this shows
- The dispatchable share of distributed storage grows faster than total battery stock.
- Residential, commercial, and EV batteries increasingly behave as grid assets, not passive loads.
- Flexibility scales with enrolment, control, and coordination, not raw capacity.
Why this matters
- Fossil peakers become obsolete
Fast, local, dispatchable energy replaces combustion-based peak supply. - EVs flip from load → asset
Managed charging and V2G turn mobility batteries into time-shifted grid support. - Reliability becomes a storage-coverage problem
Location, response speed, and availability matter more than centralised nameplate capacity. - This is a phase change
Once distributed FLEX reaches scale, system behaviour reorganises rather than incrementally improves.
Key terms (used in tables & charts)
- BTM FLEX – Dispatchable residential battery energy.
- C&I FLEX – Dispatchable commercial & industrial storage.
- EV FLEX – EV battery energy available via smart charging or V2G.
- Participation Rate – Share of assets enrolled and controllable.
- Distributed FLEX – Available, dispatchable energy only (not nameplate capacity).
Note: Distributed FLEX reflects availability, depth-of-discharge limits, participation rates, and grid constraints — not theoretical capacity.
15. Distributed Energy & Storage (BTM)

What this shows
- Residential PV and batteries scale into a meaningful decentralised energy layer.
Key terms
- PV (BTM) – Rooftop solar installations
- Batt Dur (hrs) – Average residential battery discharge duration
- BTM FLEX – Share of battery energy available for coordinated dispatch
16. Global Energy Cost Curve Collapse (2016–2035)
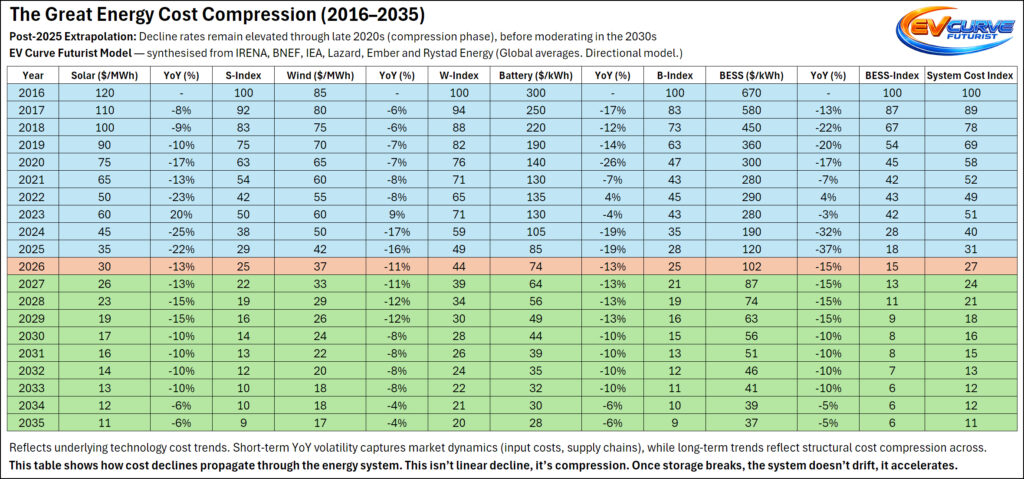
What this shows
- Technology costs fall independently of policy, subsidies, or fuel pricing.
Key terms
- Cost Index (2016 = 100) – Normalised technology cost comparison
- $/MWh – Utility‑scale energy cost
- $/kWh – Installed battery or storage system cost
- Excludes subsidies – Reflects underlying technology learning only
17. ICE vs NEV — New Car Sales Share (2016–2035)

What this shows
- Once scale breaks, ICE rapidly loses market dominance.
Key terms
- ICE – Internal combustion engine vehicles
- NEV – BEV + PHEV combined
- Sales share – Share of new vehicle sales
18. Global NEV Car Fleet & Average Battery Size (2016–2035)

What this shows
- Battery demand compounds through both fleet growth and rising average pack size.
Key terms
- Fleet (millions) – Vehicles in operation
- Average battery size – Mean pack capacity
- Battery stock – Embedded energy across all vehicles
19. Global Car Sales by Vehicle Powertrain (2016–2035)

What this shows
- BEVs drive NEV growth while ICE sales structurally decline.
Key terms
- BEV / PHEV – Battery electric / plug‑in hybrid
- NEV – BEV + PHEV combined
- ICE collapse threshold – Point where scale loss accelerates decline
20. Analysis of Global Car Sales by Vehicle Type & Market Share
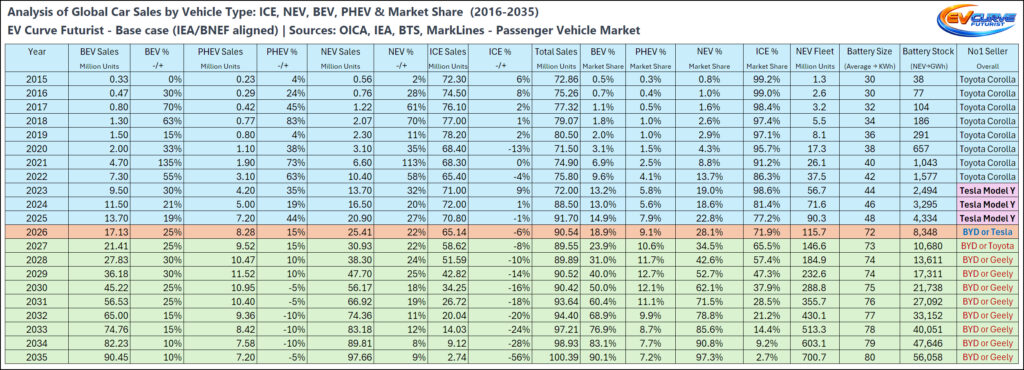
What this shows
- Market share shifts lag cost curves but accelerate once parity is crossed.
Key terms
- Market share (%) – Portion of global passenger vehicle sales
- Battery stock (GWh) – Cumulative embedded vehicle battery capacity
- No.1 seller – Year or period when BEVs become the top-selling powertrain by volume, signalling a consumer preference shift
Common Terms Used Across Tables
Units & Metrics
- GW (Gigawatt) – Unit of power (rate of energy flow). Used for installed capacity or instantaneous output, not total energy.
- GWh (Gigawatt-hour) – Unit of energy. Represents how much electricity is stored or delivered over time. Used for batteries and cumulative storage.
- TWh (Terawatt-hour) – Large-scale energy unit, typically used for annual electricity generation or consumption.
- Capacity Factor (CF) – Ratio of actual energy produced to the maximum possible output if a plant ran continuously at full power.
- LCOE (Levelised Cost of Energy) – Average lifetime cost of producing electricity ($/MWh), including capital, operations, and maintenance.
- $/kWh – Installed system-level cost per unit of energy storage (not cell cost unless stated).
- $/MWh – Cost per unit of electricity generated.
Storage & Flexibility
- BESS (Battery Energy Storage System) – Grid-scale batteries centrally dispatched to balance supply, provide firming, and manage variability.
- BTM (Behind-the-Meter) – Energy assets located on the consumer side of the meter (e.g. residential or commercial batteries).
- Distributed Storage – Storage assets spread across homes, businesses, and vehicles rather than central grid nodes.
- Distributed FLEX – The available, dispatchable portion of distributed storage (BTM, C&I, and EV batteries). Excludes nameplate capacity.
- BTM FLEX – Dispatchable share of residential battery energy available for coordinated grid dispatch.
- C&I FLEX – Dispatchable storage from commercial and industrial sites participating in grid services.
- EV FLEX – EV battery energy available via smart charging or V2G, adjusted for availability, depth of discharge, and participation.
- Dispatchable – Energy that can be delivered when required, not merely when the resource is producing.
Coordination & Grid Operation
- VPP (Virtual Power Plant) – Software-coordinated aggregation of distributed energy resources acting as a single dispatchable system.
- V2G (Vehicle-to-Grid) – Bi-directional charging allowing EVs to export energy back to the grid.
- Curtailment – Renewable energy generated but not used or stored due to grid constraints or oversupply.
- Hours Equivalent / Storage Coverage (hrs) – Storage energy divided by average renewable output; indicates buffering depth, not full system backup.
- Abundance Management – System strategies that monetise surplus renewable energy instead of wasting it.
Vehicles & Electrification
- NEV (New Energy Vehicle) – In this analysis: BEV + PHEV only (excludes fuel-cell vehicles).
- BEV (Battery Electric Vehicle) – Fully electric vehicle with no combustion engine.
- PHEV (Plug-in Hybrid Electric Vehicle) – Vehicle capable of meaningful electric-only operation with external charging.
- ICE (Internal Combustion Engine) – Petrol or diesel vehicles, including all non-plug-in hybrids (HEVs and mild hybrids).
System Scale & Dynamics
- Battery Stock – Total embedded battery energy across a fleet or system, measured in GWh.
- Participation Rate – Share of installed assets enrolled and available for coordinated dispatch.
- Scale Break / Scale Threshold – Point at which cost, volume, and infrastructure become self-reinforcing, accelerating adoption independent of policy.