
Energy is not undergoing a linear transition. It is experiencing a phase change.
This page explains why the global energy system is irreversibly shifting — driven not by ideology or policy preference, but by physics, economics, and scaling laws. It forms part of the broader Bettrification Framework, which describes how electrification, storage, software, and intelligence compound into a system-wide rewrite of civilisation’s core engines. The charts referenced here quantify that shift. Detailed datasets and full model tables live separately under Bettrification Engine Data to preserve clarity while maintaining transparency.
The Prime Mover: Cost Curves Are Gravity
This is the same force described in the Bettrification framework as the moment when optimisation replaces extraction and cost curves begin to dictate system architecture rather than policy intent.
When a technology’s cost curve falls far enough, adoption stops being optional. It becomes inevitable.
Across solar, wind, and battery storage, the same dynamic repeats:
- Costs fall first
- Deployment responds second
- Scale then accelerates further cost decline
This is not a feedback loop driven by sentiment — it is an industrial gravity well.
Data sources:
- https://www.irena.org/Publications
- https://ember-climate.org/
- https://www.iea.org/
- https://about.bnef.com/
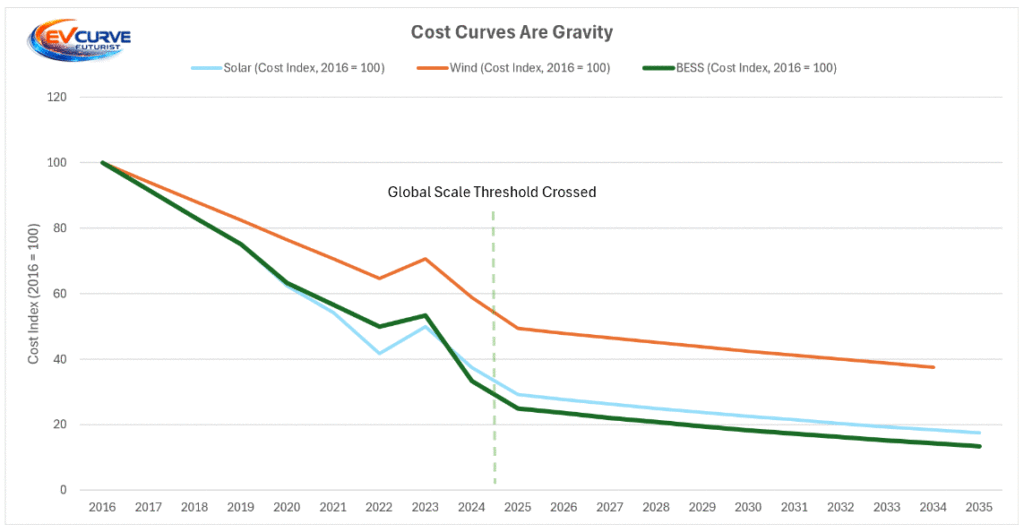
What this chart shows:
- Solar, wind, and BESS costs indexed to a common baseline (2016 = 100)
- Relative cost collapse across technologies, independent of units or currency
- Temporary shocks (e.g. 2022–2023) fade; learning curves persist
- Around 2024–2025, global scale effects dominate pricing dynamics
Context:
This chart is the root cause of every other energy chart on this page. It explains why deployment accelerates without requiring policy synchronisation or behavioural change.
Key takeaway: Cost curves don’t negotiate. Systems reorganise around them.
The Generation Gravity: Solar
Solar is the first technology to fully cross the cost–scale threshold, and it sets the pace for the rest of the system.
Once solar becomes the cheapest marginal unit of electricity, deployment is no longer constrained by policy ambition — only by manufacturing and grid absorption.
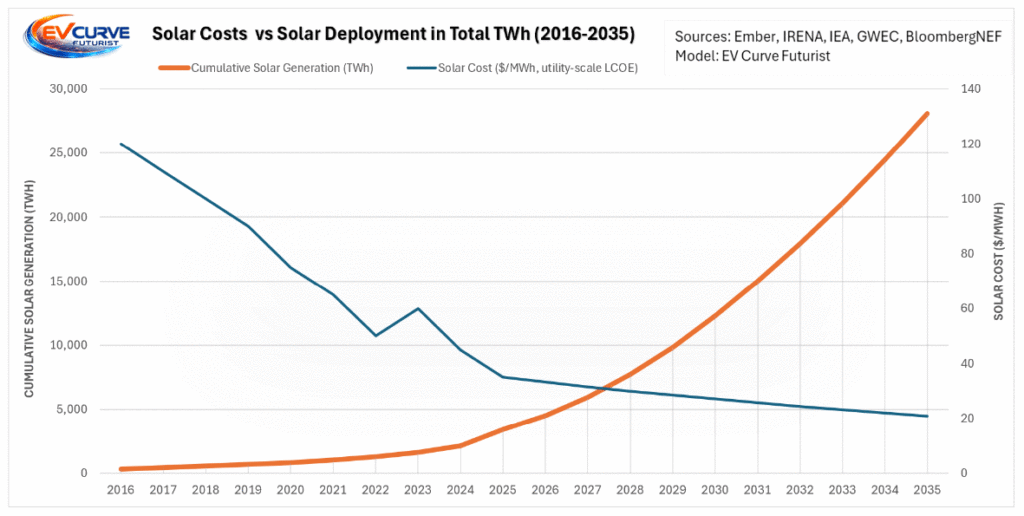
What this chart shows:
- Cost declines precede deployment acceleration
- Scale emerges only after sustained cost compression
- Once crossed, growth compounds rather than stabilises
Context:
Solar is the prime mover of the energy phase change. It forces every downstream system — grids, storage, transport, and industry — to adapt.
The Generation Gravity: Wind
Wind follows the same gravity-driven pattern as solar, with a slower learning rate but equally durable scale effects.
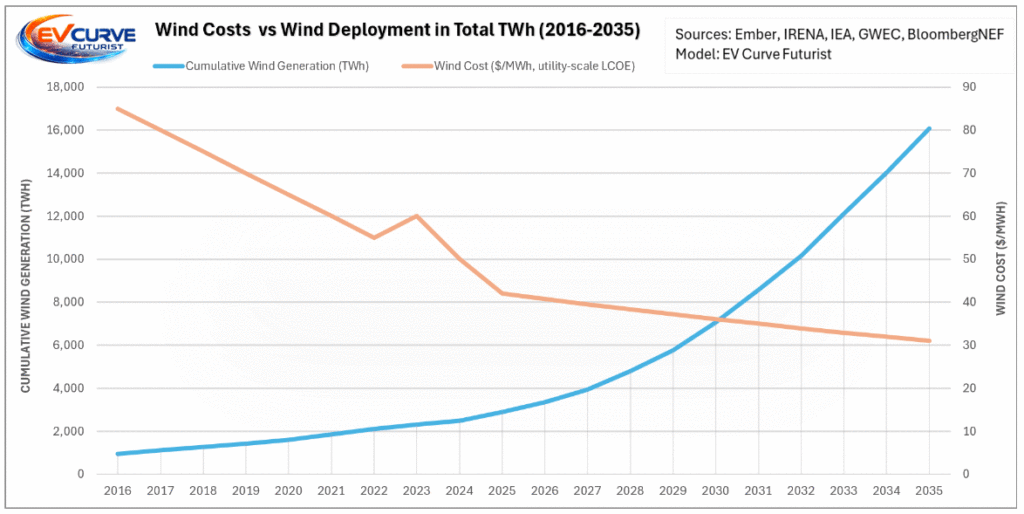
What this chart shows:
- Deployment responds to cost, not mandates
- Offshore and onshore learning curves converge over time
- Wind provides seasonal and geographic complementarity to solar
Context:
Wind does not replace solar — it stabilises the system solar creates.
BESS: From Constraint to Enabler
Intermittency is not solved by belief — it is solved by capacity, duration, and cost.
Battery Energy Storage Systems (BESS) follow the same gravity:
- Early years: short‑duration, lithium‑dominated
- Mid‑2020s: grid‑scale economics lock in
- Post‑2030: multi‑hour coverage becomes structural
Supporting analysis:
What this chart shows:
- Storage deployment remains limited while costs are high
- Once BESS falls below key cost thresholds, annual additions accelerate sharply
- Storage scales because it becomes economical, not because it is mandated
Context:
Storage is the last piece to fall into place — but once it does, system behaviour changes rapidly.
System Balance: Quantifying the Phase Change
By aggregating solar, wind, and storage additions, the system‑level rewrite becomes visible.
This is not about replacing individual power plants — it is about crossing a storage‑enabled threshold where renewables behave like a firm, dispatchable system.
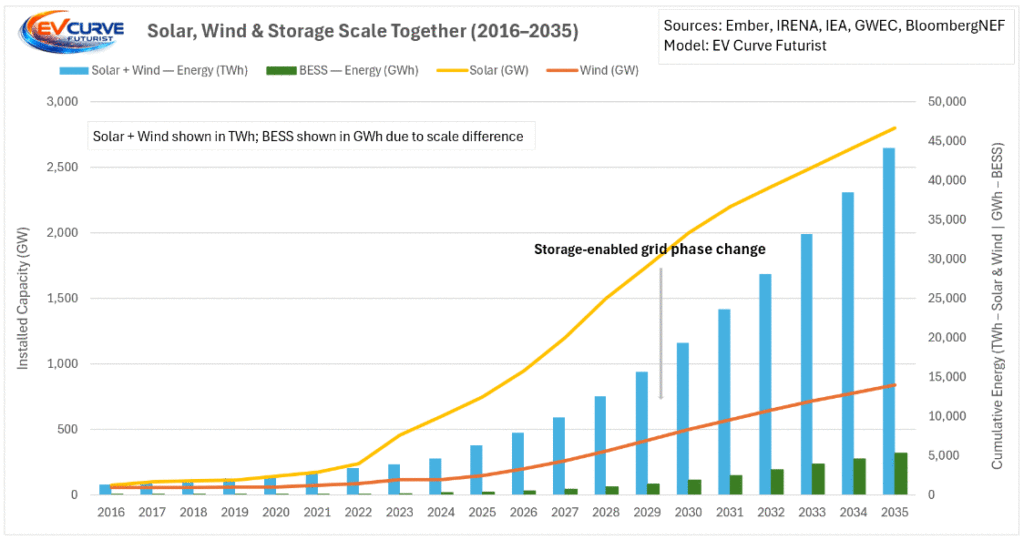
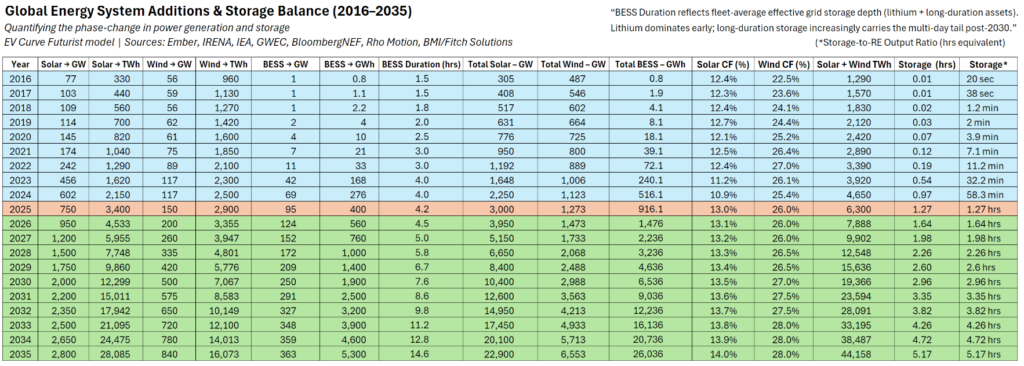
Anchor Table: Global Energy System Additions & Storage Balance (2016–2035)
[Table hook → Insert: “Global Energy System Additions & Storage Balance”]
What this table establishes:
- Generation (solar + wind) scales first
- Storage lags, then accelerates sharply
- Grid storage duration rises from seconds → minutes → hours
- Post‑2030, storage becomes a structural system component, not an add‑on
Context:
This table is the backbone of the page. Every chart above and below is derived from this system balance.
By aggregating solar, wind, and storage additions, the system-level shift becomes visible.
This is not about replacing individual power plants — it is about rewriting system balance.
What this chart establishes:
- Generation scales first
- Storage lags, then rapidly closes the gap
- The system transitions from energy‑scarce to energy‑buffered
BTM + V2G: Distributed FLEX Emerges
Centralised storage is only half the story.
Behind‑the‑meter batteries, commercial storage, and EVs participating in V2G/VPPs introduce distributed flexibility — energy that is local, fast, and grid‑supportive.
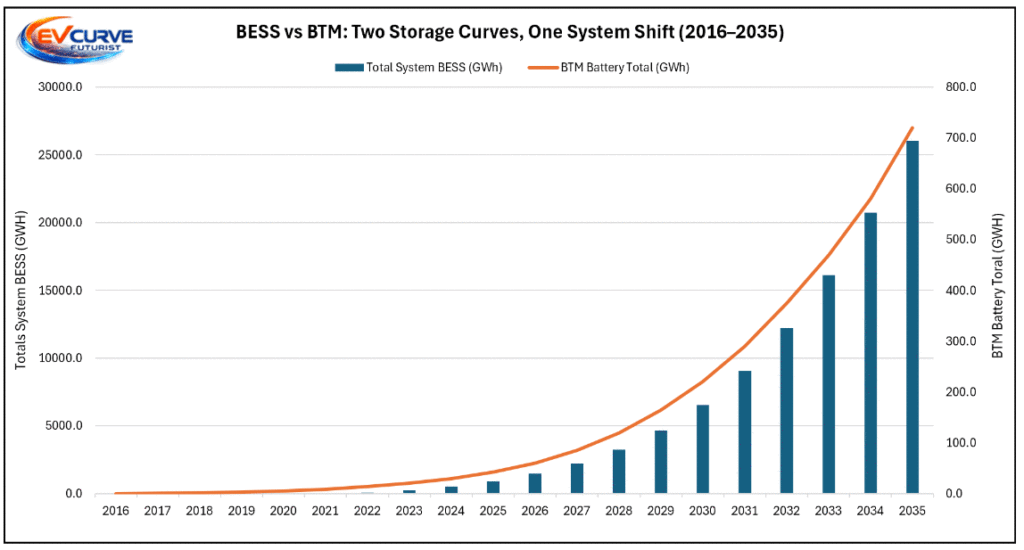
Context:
- Grid‑scale BESS delivers bulk energy shifting and firming
- BTM storage delivers peak shaving, congestion relief, and resilience
- EVs extend storage temporally (mobility‑linked) and spatially (edge‑of‑grid)
- These systems scale in parallel, not in competition
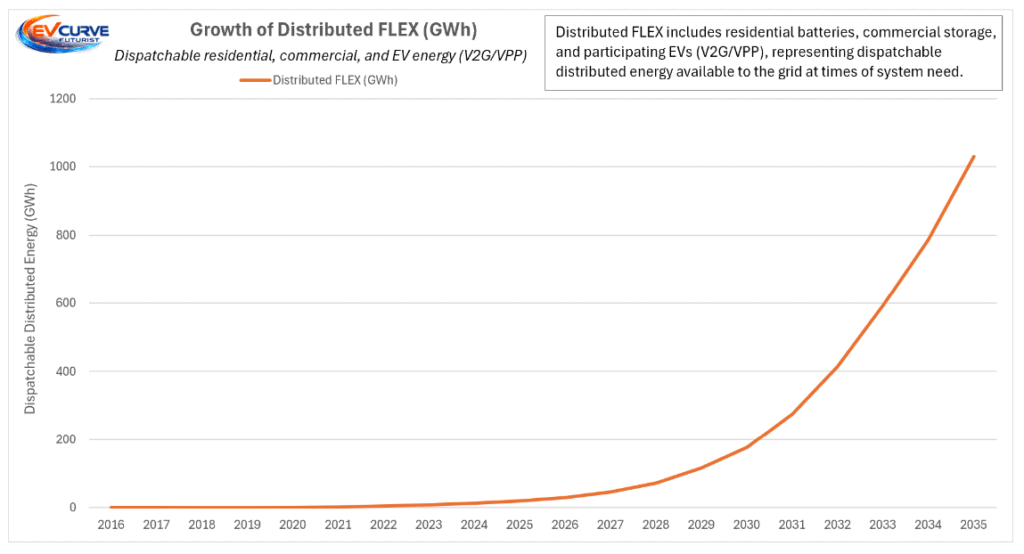
What this chart captures:
- Early growth driven by residential batteries
- Mid‑2020s acceleration from commercial & industrial storage
- Post‑2027 inflection as EV participation (V2G/VPPs) rises
- By the early‑2030s, EVs become the dominant marginal source of new distributed FLEX
Interpretation:
Distributed FLEX delivers disproportionate value relative to energy share — because location, response speed, and coordination matter more than raw volume.
Footnote (important):
Distributed FLEX here reflects available, dispatchable share — constrained by participation rates, inverter limits, grid conditions, and user opt‑in. This avoids overstating V2G impact while still capturing its system‑level significance.
Storage Coverage: The Real Reliability Metric
Rather than debating nameplate capacity, the relevant question is:
How many hours of renewable output can the grid absorb, store, and redeploy?
Measured this way, the transition is already visible.
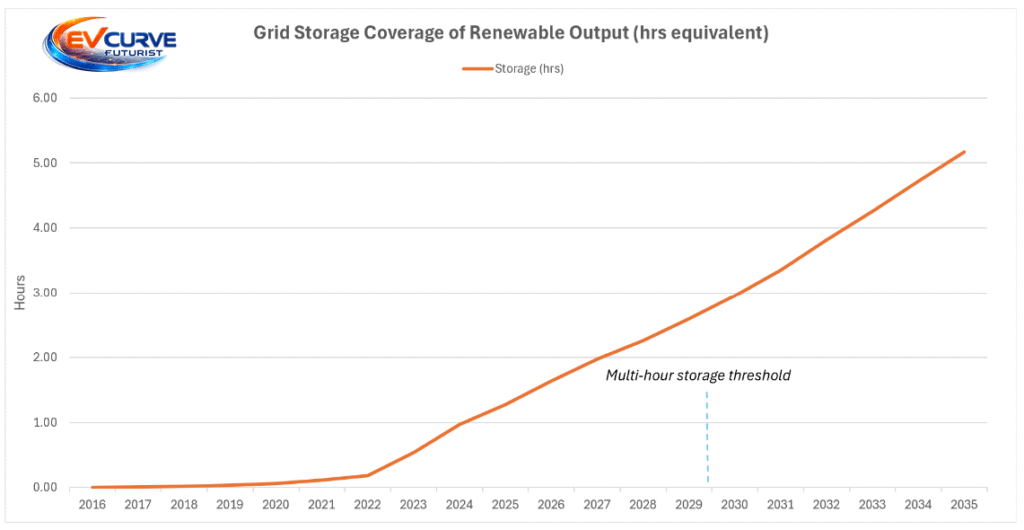
Interpretation:
- Seconds → minutes → hours is not symbolic — it is operational
- Multi‑hour coverage marks the end of fossil peaking logic
What This Page Is — and Is Not
This page explains causality.
It is not a database.
For full tables, projections, assumptions, and sensitivity ranges, see:
Bettrification Engine Data (dedicated data & charts page)
Bettrification: The New Industrial System
Common Pushbacks (Closed)
“These costs depend on subsidies.”
Learning curves persist globally across markets with vastly different policy regimes.
“Intermittency makes this unreliable.”
Reliability is a storage‑to‑generation ratio problem — now being solved at scale.
“These are projections.”
The slope is empirical. Extrapolation only extends established trends.
“Fossil fuels are still cheaper.”
System cost ≠ fuel cost. Dispatchability is now being provided by storage, not combustion.
Bottom line:
Once cost curves cross critical thresholds, systems do not transition — they reorganise.
This is not an energy transition.
It is an energy phase change.