Energy Density, Cost Curves, and the Structural Economics of the Battery Revolution
The Bettrification era — the global shift from combustion to electrons — is ultimately a battery story.
The global battery landscape in 2026 is not defined by a single breakthrough chemistry. It is defined by layered, compounding evolution.
Bettrification is often framed as electrification at scale — the replacement of combustion with electrons across transport, storage, and industry. But without batteries — their falling cost curves, rising energy density, improving safety, and manufacturing scale — Bettrification simply does not happen. Solar and wind generate electrons; batteries make them portable, dispatchable, and economically viable in mobility.
If the era were named purely by its enabling technology, it could just as easily be called “Batteryfication.” Batteries sit at the structural center of the transition: they compress cost curves, unlock EV adoption, stabilize grids, and determine the performance ceiling of electrified systems.
The data from 2010–2026 tells a very clear story.
Cost curves — not chemistry alone — are the real engine of Bettrification.
In other words: battery capability has been getting dramatically cheaper faster than chemistry has been getting denser.
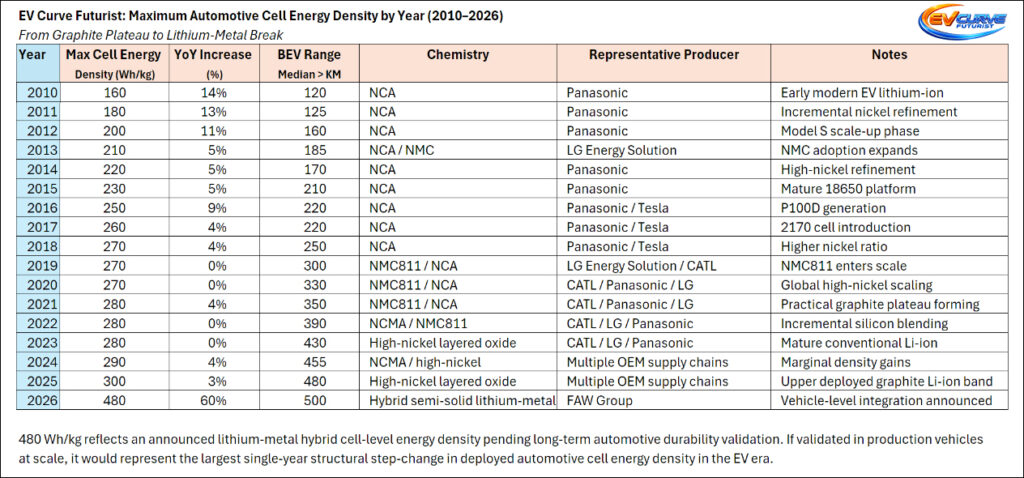
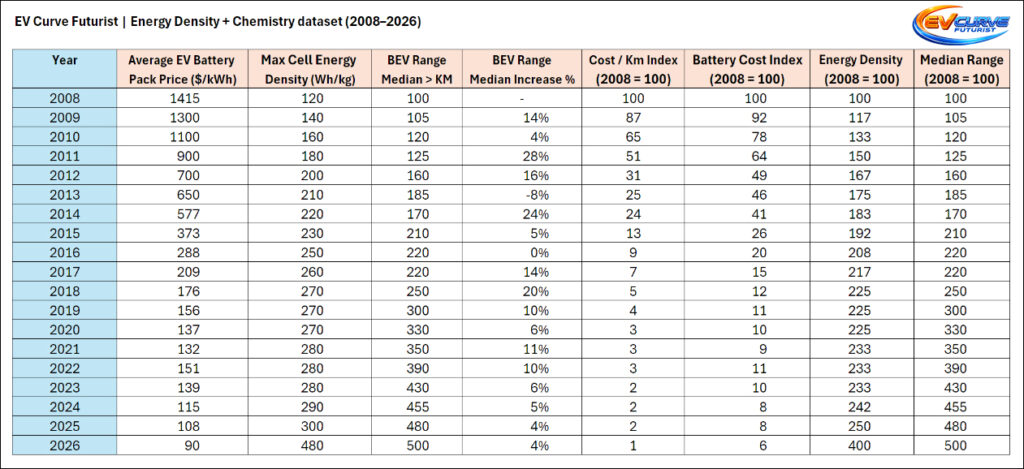
Values reflect maximum deployed automotive cell densities reported in commercial programs (integrated in commercial vehicles, not lab-only cells).
From 2010 to 2018, maximum deployed automotive cell energy density climbed from 160 Wh/kg to ~270 Wh/kg — a steady refinement era dominated by nickel optimization in NCA and later NMC811 systems. Between 2018 and 2023, density largely plateaued in the 270–280 Wh/kg band, marking the practical graphite-anode ceiling for conventional lithium-ion architectures.
Incremental gains resumed in 2024–2025, pushing toward ~290–300 Wh/kg, but these represented marginal refinement rather than structural transformation.
Then came the 2026 inflection.
The announced ~500 Wh/kg lithium-metal hybrid cell integration — pending independent validation at automotive cycle-life, safety, and durability standards — represents a potential 67% single-year jump from the prior ~300 Wh/kg maximum deployed ceiling. If validated at production scale, it would mark the largest structural step-change in automotive cell energy density in the EV era.
This table maps that evolution clearly: from graphite-limited plateau to potential lithium-metal breakout.
Table 1. Maximum Automotive Cell Energy Density by Year (2010–2026) — illustrating the progression from the graphite plateau to the announced lithium‑metal hybrid step-change. The table also tracks median BEV range progression to highlight the divergence between chemistry limits and vehicle-level efficiency improvements.
It is not hype. It is measurable progression — and the updated chart and table illustrate how chemistry limits, falling battery costs, and system-level efficiency improvements interacted across the EV era.
From 160 to 300 Wh/kg took fifteen years. The next structural leap may compress that timeline dramatically.
This landscape maps the commercial, emerging, and experimental battery chemistries of 2026 by cell-level gravimetric energy density (Wh/kg) and contextualizes them within a 16-year deployment curve.
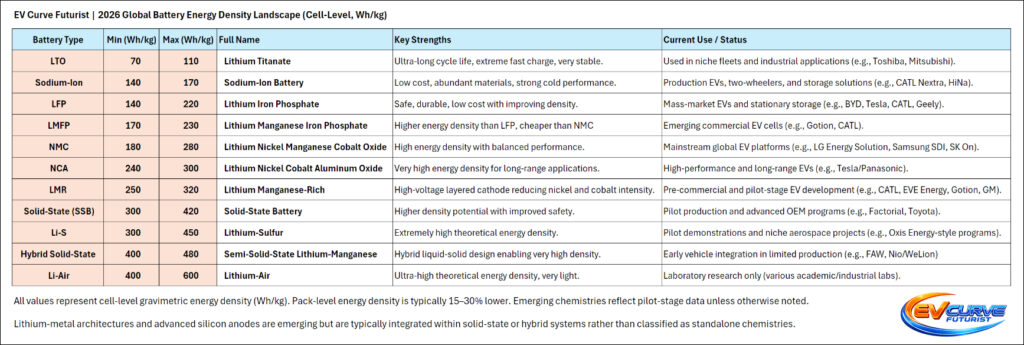
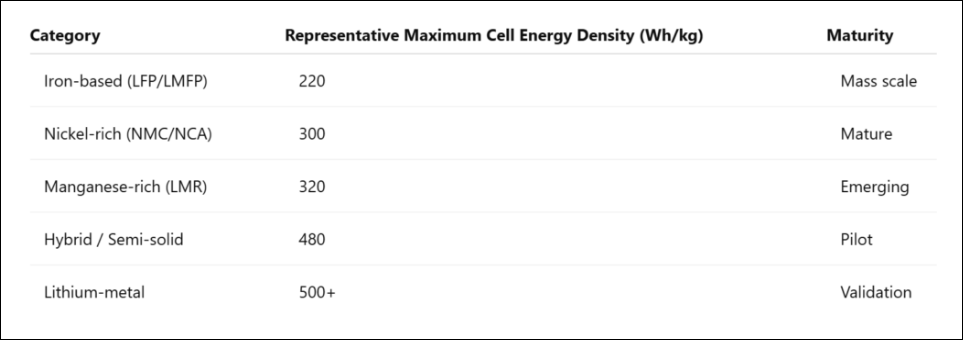
Chart 1. The EV Range Paradox: Energy Density Plateau vs BEV Range Growth (2009–2026). This chart overlays three structural curves — maximum automotive cell energy density, median BEV range, and average EV battery pack cost. The result illustrates a key Bettrification dynamic: even while cell density plateaued near the graphite ceiling (~270–300 Wh/kg), BEV range continued climbing as battery costs fell and system-level efficiency improved.
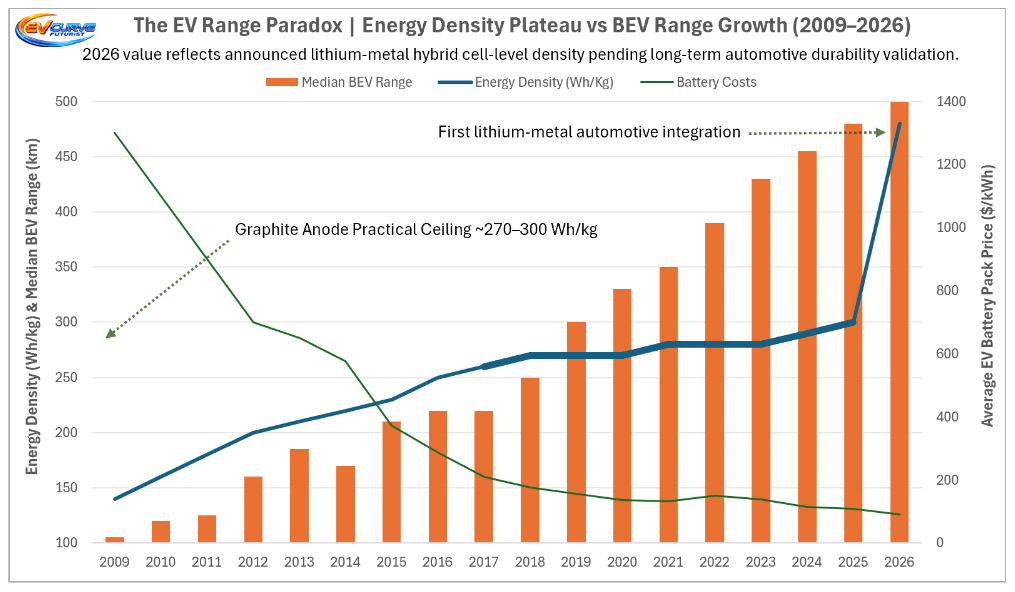
Chart 2. Relative Growth Index (2008 = 100): Energy Density, BEV Range, and Battery Cost Curves. By indexing the key variables to a 2008 baseline, the structural divergence becomes clearer: energy density roughly tripled over the period, while median BEV range expanded roughly fivefold and battery costs collapsed. Measured another way, the cost of EV battery capability — dollars per kilometre of range — has fallen by ~99% since 2008, illustrating the true economic engine of Bettrification: falling battery costs combined with steady chemistry and efficiency improvements.
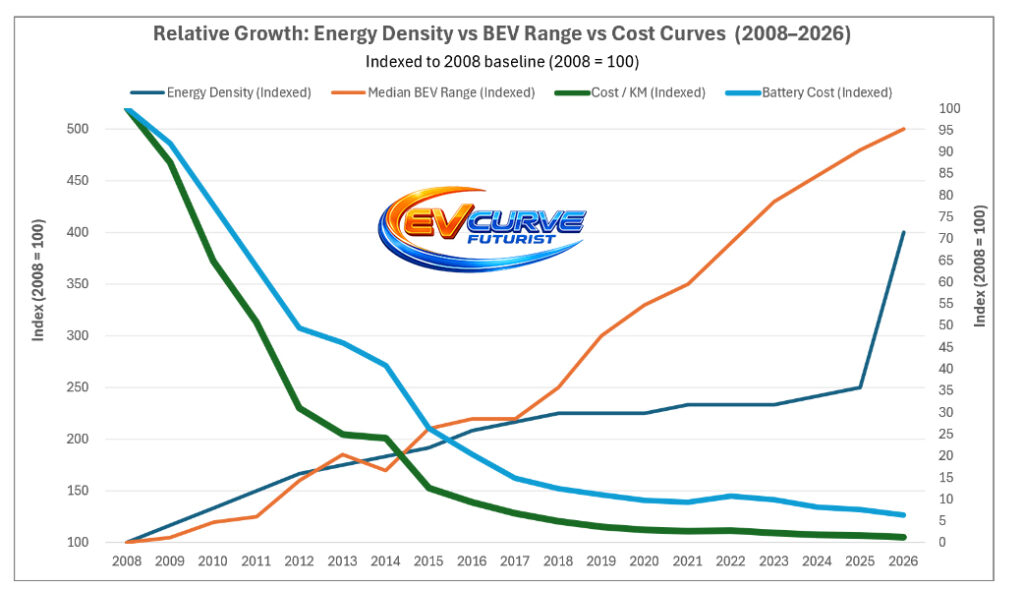
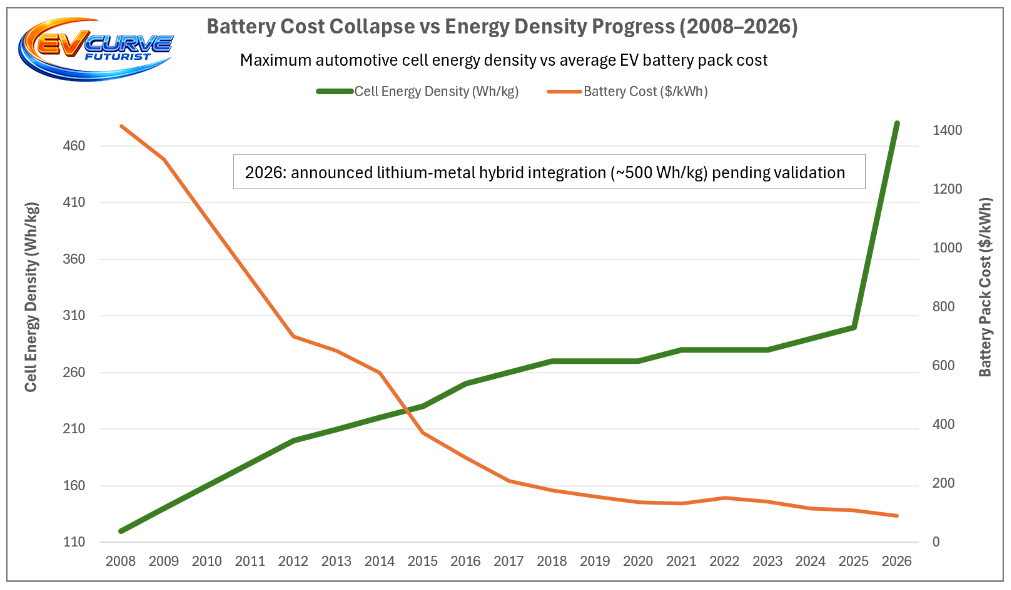
Chart 3. Battery Cost Collapse vs Energy Density Progress (2008–2026). This chart directly compares maximum automotive cell energy density with average EV battery pack cost across the modern EV era. While cell energy density roughly doubled from ~160 Wh/kg to ~300 Wh/kg during the graphite‑anode era, battery pack costs collapsed by more than 90%. The divergence explains why EV range and affordability expanded rapidly even during the chemistry plateau. The 2026 data point reflects the announced lithium‑metal hybrid integration (~500 Wh/kg) pending independent validation.
The Economics Behind the Curve
Energy density improvements explain what batteries can do.
Cost curves explain why they scale.
From 2010 to 2026, maximum deployed automotive cell energy density rose from roughly 160 Wh/kg to around 300 Wh/kg, before the emergence of ~500 Wh/kg lithium-metal hybrid systems began pushing the frontier further.
Over the same period, battery pack costs collapsed by more than 90%.
This divergence is one of the defining dynamics of the Bettrification transition.
While chemistry improvements expanded the technical frontier, falling costs expanded the economic frontier. Vehicles became more affordable, battery packs grew larger, and manufacturers could scale production without prohibitive price penalties.
Measured another way, the cost of battery capability — dollars per kilometre of EV range — has fallen by roughly 99% since the late 2000s.
This explains a key paradox visible in the charts above: even while energy density plateaued near the graphite-anode ceiling (~270–300 Wh/kg), EV range continued rising and adoption accelerated.
Technology revolutions rarely unfold through a single breakthrough. Instead they follow a familiar pattern:
costs fall → deployment grows → scale drives further cost reductions.
Chemistry improvements matter.
But cost curves are what flip industries.
As battery costs continue to fall and density advances toward ~500 Wh/kg and beyond, the set of economically viable applications expands — from passenger vehicles to heavy transport, grid storage, maritime electrification, and eventually aviation.
Energy density sets the outer boundary of possibility.
Cost curves determine how quickly the world moves toward it.
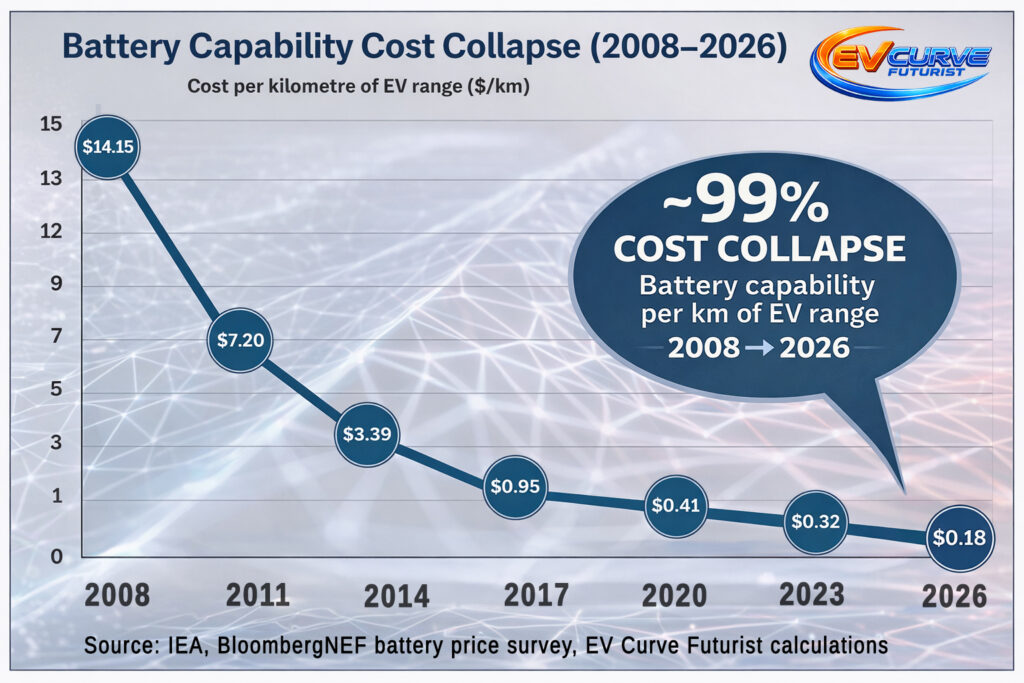
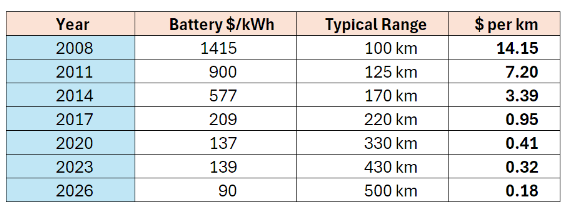
Battery capability cost collapsed from $14.15/km in 2008 to $0.18/km in 2026 — nearly an 80× improvement. This is the economic engine behind the EV revolution. Cost curves create adoption curves.
Energy Density Is Only One Dimension
Energy density matters — but it does not stand alone.
Cycle life, safety, fast-charging capability, cost per kWh, and material intensity are equally decisive. LFP dominates global EV volumes not because it leads density, but because it optimizes durability, safety, and cost at scale. Higher-density systems often introduce greater material complexity and engineering trade-offs.
The Bettrification curve is about improving all variables simultaneously — not maximizing one at the expense of the others.
What the 2026 Landscape Reveals
1. The Iron Plateau Has Moved
LFP has advanced significantly over the past five years. Structural integration (e.g., blade-style formats), improved cathode loading, and pack architecture optimization have pushed commercial LFP toward the 210–220 Wh/kg band. LMFP extends this trajectory further by incorporating manganese to raise voltage and density without abandoning safety or cost discipline.
The outdated narrative of “low-density iron batteries” no longer reflects market reality. When LFP moves from ~140 Wh/kg toward 210–220 Wh/kg in mainstream production, that is not incremental noise — it is structural progress measured in real-world vehicles.
2. Nickel Chemistries Are Near Maturity
High-nickel NMC, NCMA, and NCA systems now operate near practical commercial ceilings around 280–300 Wh/kg, meaning future gains are increasingly marginal rather than exponential.
3. The Manganese Bridge
Lithium Manganese-Rich (LMR) layered oxides represent the most realistic evolutionary step before widespread solid-state adoption. By reducing nickel and cobalt intensity while increasing operating voltage, LMR offers a pathway to 300+ Wh/kg without fully abandoning conventional manufacturing infrastructure.
This is incremental disruption — not a clean break. LMFP (170–230 Wh/kg) represents the near-term manganese bridge within iron-based systems, while LMR (250–320 Wh/kg) extends that bridge into high-voltage layered cathodes. Together, they illustrate a manganese-led density pathway that complements rather than replaces existing infrastructure.
4. Solid-State Is Gradual, Not Binary
All-solid-state batteries (SSB) are in pilot production and advanced OEM programs. Semi-solid or hybrid architectures are already entering limited vehicle integration. The transition will likely be phased and hybridized, rather than a sudden technological leap.
Energy density levels above 400 Wh/kg are emerging — whether in solid-state (300–420 Wh/kg) or hybrid semi-solid systems pushing toward the 400–480 band — but scale, cost, and durability remain the gating factors.
5. The Experimental Frontier
Lithium-sulfur and lithium-air remain high-theoretical-density systems with long-term potential. Lithium-air, in particular, represents the only chemistry on this landscape with theoretical headroom approaching the multi‑kilowatt‑hour‑per‑kilogram pack densities that long-haul aviation would ultimately require. However, cycle life, stability, oxygen management, and manufacturability challenges keep both chemistries firmly in laboratory or early pilot domains in 2026. No credible automotive commercialization roadmap exists for lithium-air within the 2020s.
They represent asymptotes of possibility — not near-term mass adoption.
Structural Reality
All values in this landscape represent cell-level gravimetric energy density (Wh/kg).
Pack-level energy density is typically 15–30% lower due to thermal management, structural components, and battery management systems.
Lithium-metal architectures and advanced silicon anodes are emerging but are typically integrated within solid-state or hybrid systems rather than classified as standalone chemistries.
Footnote: An indexed comparison (2010 = 100) of maximum cell energy density versus median BEV range shows that while cell density roughly doubled from 2010 to 2025 prior to the announced 2026 lithium-metal step, median BEV range expanded by approximately fourfold over the same period. This divergence reflects system-level optimization — aerodynamics, drivetrain efficiency, pack integration, and software — compounding alongside chemistry improvements.
Sodium-Ion: The 2030 Scale Question
A growing narrative suggests sodium-ion in 2030 could sit where LFP stood five years ago — early, underestimated, and on the verge of major scale. It’s an understandable comparison. Sodium offers abundant materials, strong cold-weather performance, and a clear long-term cost advantage. If it scales, it strengthens the entire electrification ecosystem.
The comparison, however, needs structural context.
In 2020, global EV sales were roughly 3 million units. In 2026, the market is tracking toward ~25 million EVs annually — an expansion of more than eightfold in just six years.
That scale shift changes the mechanics of adoption.
LFP expanded into a market that was still forming. Sodium-ion is entering a market that is already massive, globally competitive, and heavily capitalized. Manufacturing lines are optimized, supply chains are entrenched, and chemistry trade-offs are better understood.
This does not argue against sodium — quite the opposite. Sodium-ion has a clear role to play, particularly in short-range vehicles, two-wheelers, and stationary storage where cost, cold performance, and resource flexibility matter more than maximum energy density. With cell-level densities typically in the 140–170 Wh/kg band (and materially lower at pack level), sodium sits well below even the ~400–500 Wh/kg cell-level thresholds associated with short-range electric aviation. The capital barrier to displacement in 2026 is structurally higher than it was in 2020. Its future is segmentation, not altitude.
If sodium-ion succeeds — and there are strong reasons to believe it can — it may not replicate LFP’s early trajectory. Instead, it will scale alongside iron and nickel chemistries, expanding the total addressable market rather than replacing existing platforms.
The real question for 2030 is not whether sodium scales — it likely will — but whether it can scale profitably in a market already orders of magnitude larger and more capital intensive than the one LFP disrupted.
The Bettrification Takeaway
The battery race in 2026 is not about a single chemistry “winning.” It is about compounding improvements across safety, cost, density, and scale.
Iron chemistries are climbing.
Nickel chemistries are stabilizing.
Manganese is bridging.
Hybrid solid-state systems are emerging.
Experimental systems are probing the frontier.
This is how Bettrification unfolds: not through a singular breakthrough, but through layered, accelerating refinement — year after year.
So What Does This Mean?
For EV buyers: The chemistry you purchase today will not be obsolete tomorrow. Iron-based systems are densifying and improving in durability, meaning affordable EVs will continue to gain range and resilience without dramatic cost spikes.
For investors: The next structural winners are unlikely to come from a single miracle chemistry. They will emerge from companies that master integration — manganese optimization, silicon-enhanced anodes, semi-solid architectures, and scalable manufacturing.
For the broader energy system: More chemistries do not fragment the transition — they accelerate it. Sodium-ion, LFP, LMFP, nickel-rich cathodes, and emerging hybrids expand the total addressable market. The result is not replacement, but compounding scale.
The Bettrification era reflects convergence: density rising from 140 toward 220 in iron systems, clustering near 300 in nickel systems, and probing 400+ in solid-state architectures. The pattern is structural accumulation rather than singular explosion.
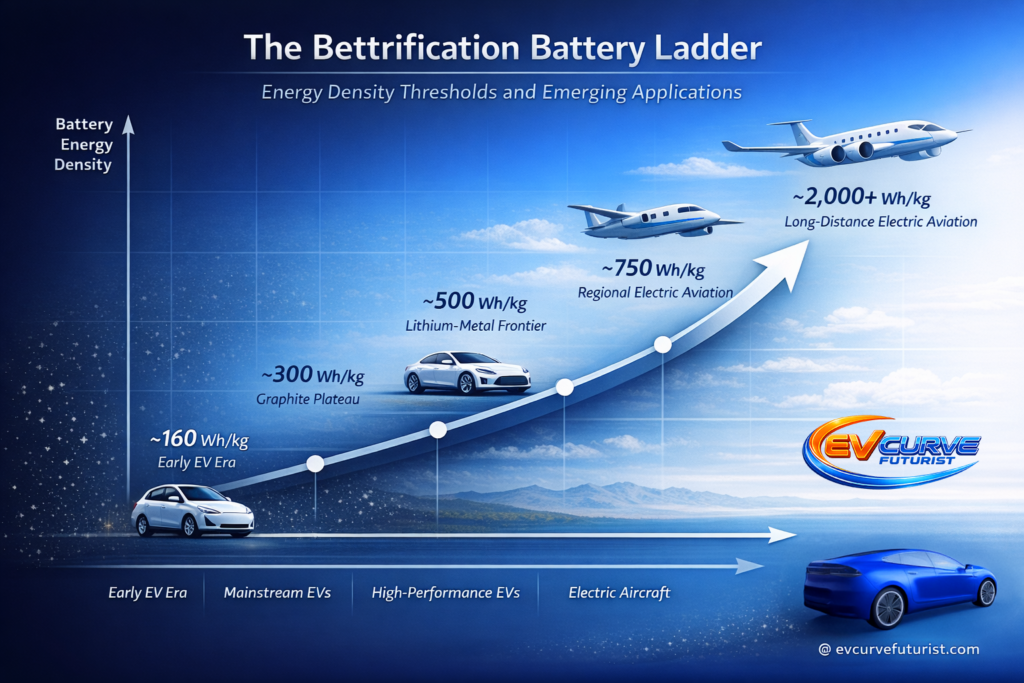
High-Intensity Use Cases: What Density Is Actually Required?
Energy density debates often lack context. The real question is not “What is the highest Wh/kg achieved?” but “What density is required for extreme applications?”
Aviation provides the clearest stress test.
Short-Range Electric Aviation
For small training aircraft and short-hop commuter planes, cell-level energy densities in the ~400–500 Wh/kg range begin to make fully electric configurations technically viable.
At this level, the efficiency advantage of electric propulsion helps offset part of the raw energy gap with jet fuel. Electric motors convert energy to thrust far more efficiently than combustion engines, enabling short missions with acceptable payload trade-offs.
This density frontier is now being explored by semi-solid architectures, advanced silicon anodes, and emerging lithium-metal hybrid cells.
Early commercial electric aircraft will therefore likely appear first in:
- pilot training aircraft
- short-range commuter routes
- specialized regional transport
These missions operate within energy budgets that batteries are beginning to approach.
Regional Aviation
Electrifying meaningful regional air routes requires a substantial step beyond current lithium-ion performance.
Analysis across multiple aviation studies suggests cell-level energy densities near ~750 Wh/kg may be necessary for viable regional electric aircraft. At this level, battery systems could support flights in the 1,000–3,000 km range, depending on aircraft design and payload constraints.
Reaching this threshold will likely require lithium-metal architectures, high-silicon anodes, or hybrid solid-state systems, alongside major advances in structural battery integration and aircraft design.
This remains a frontier still under active research.
Long-Haul (10,000 km) Battery Flight
The constraint here is fundamentally thermodynamic.
Jet fuel contains roughly 43 MJ/kg of specific energy, while modern lithium-ion battery packs typically operate around 0.7–0.8 MJ/kg at pack level in mainstream electric vehicles.
Even accounting for the higher efficiency of electric propulsion, the gap in energy-per-mass remains enormous.
Aircraft also benefit from a structural advantage that batteries lack:
fuel mass decreases during flight, reducing aircraft weight as the journey progresses. Batteries retain their full mass from takeoff to landing.
To enable a wide-body aircraft to travel roughly 10,000 km on battery power alone would likely require pack-level energy densities well above 1,000 Wh/kg, and realistically much higher when accounting for reserves, payload, and structural mass.
No credible roadmap suggests such pack-level densities will emerge in the 2020s or early 2030s using conventional lithium chemistries.
However, the frontier of battery research continues to advance.
Laboratory prototypes using lithium-sulfur, lithium-metal, and metal-air architectures have already demonstrated cell-level densities approaching or exceeding ~1,000 Wh/kg under experimental conditions.
These systems remain far from commercial deployment. Challenges around cycle life, stability, manufacturability, and cost remain substantial.
But they demonstrate an important point:
The physical frontier of electrochemical storage lies well beyond today’s commercial batteries.
As AI-driven materials discovery, automated experimentation, and large-scale research infrastructure accelerate battery R&D, the time required to move from laboratory breakthroughs to manufacturable systems compress significantly.
This does not eliminate engineering constraints. But it does suggest that the frontier is moving faster than many observers assume.
Density Thresholds vs Aviation Range (Illustrative)
All values below refer to pack-level energy density.
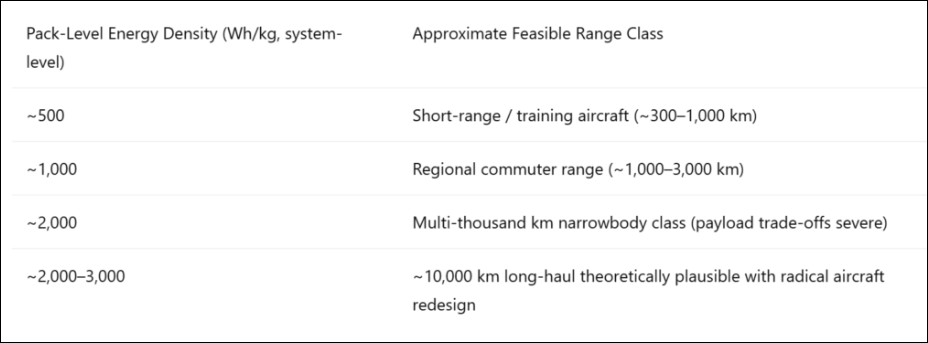
These figures are illustrative and assume major aerodynamic optimization, structural integration, and certification breakthroughs. They reflect pack-level energy density, not cell-level laboratory values.
What This Means for Bettrification
Battery-electric aviation will likely scale first where physics allows:
• training aircraft and short-range missions
• urban and regional mobility
• hybrid-electric configurations
Long-haul decarbonization is more likely to involve hybrid architectures, hydrogen-derived fuels, or sustainable aviation fuels rather than purely battery-electric propulsion in the near term.
This is not a limitation of progress — it is an illustration of how technological revolutions unfold.
As energy density rises and battery costs fall, the range of economically viable applications expands.
Road transport electrified first because it sits comfortably within current density thresholds. Grid storage followed because cost, durability, and scale matter more than density.
Aviation arrives later because its constraints are fundamentally different.
But the pattern remains the same.
As the frontier advances, the addressable market expands.
That is Bettrification in action.
From Energy Density to System Transformation
Aviation illustrates the outer boundary of battery physics, but it also reveals something deeper about technological transitions. Progress rarely unfolds evenly across all sectors. Instead, it propagates through the economy in layers, beginning where physics, economics, and engineering constraints are most favourable.
Road transport electrified first because it sits within achievable energy-density thresholds. Grid storage followed because cost, durability, and scale matter more than density. Aviation arrives later because its constraints are fundamentally different.
This pattern is not a limitation of Bettrification; it is evidence of how technological revolutions unfold. As energy density improves and costs fall, the range of economically viable applications expands. What begins with road vehicles gradually reshapes logistics, infrastructure, and energy markets.
Aviation simply reminds us that physics still defines the outer boundary of the curve — even as that boundary continues to move.
Conclusion
The evolution of batteries from 2008 to 2026 reveals how real technological revolutions unfold — not through a single breakthrough, but through compounding progress. Energy density rises, costs fall, manufacturing scales, and adoption accelerates.
Iron chemistries continue climbing in density while maintaining their safety and cost advantages. Nickel systems have largely matured near the 300 Wh/kg frontier, while manganese-rich and hybrid architectures are beginning to push the next frontier toward ~500 Wh/kg. At the same time, battery costs have collapsed, unlocking EVs, grid storage, and electrified industry at global scale.
Solar and wind generate the electrons, but batteries make them portable, dispatchable, and economically usable. From roughly 160 Wh/kg in 2010 to around 300–500 Wh/kg today — and potentially far higher in the coming decade — the battery has quietly become the central enabling technology of the electrified economy.
The battery revolution is not a single breakthrough. It is a compounding curve, and we are still early.