
The Solar Scale Curve Is Real
Solar has moved beyond experimentation. We are now seeing industrial-scale deployment, measured in gigawatts per site, not megawatts. The projects below are not just power plants. They are signals of where the global energy system is heading.
This is a snapshot of the Top 10 largest operational solar projects in the world, based on a consistent methodology:
- Data based on official project announcements and grid connection reports as of March 2026
- Where available, annual generation estimates (TWh) and implied capacity factors are included
- Homes powered figures use a global average of ~8,000 kWh per household annually, which results in lower estimates than regional figures often quoted for developing markets
- Using local consumption assumptions would increase these figures significantly
- Operational capacity only
- PV only
- Clear distinction between single sites and clusters
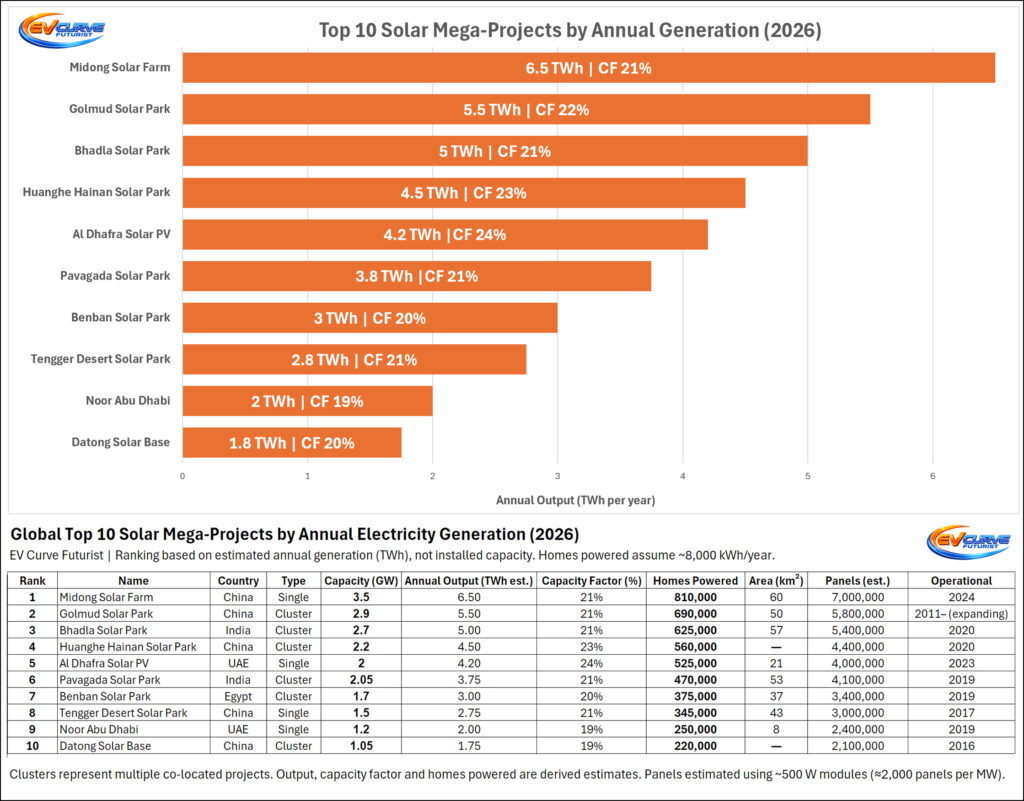
Higher output isn’t just about size. Location, technology, and capacity factor determine how much energy each gigawatt actually delivers.
1. Midong Solar Farm, China
3.5 GW | Single site
Midong currently holds the title as the largest single-site solar PV plant in the world. Located in Xinjiang, it represents the new ceiling of utility-scale solar. Built in a high-irradiance desert region, it delivers strong output and sets the benchmark for what a modern giga-scale project looks like. At roughly 6.5 TWh per year, this implies a capacity factor of ~21%. This is no longer about proving solar works. It is about scaling it as fast as possible.
2. Golmud Solar Park, China
2.9 GW | Cluster
Golmud is not a single plant but a coordinated cluster of projects spread across Qinghai. It functions as a unified solar base, sharing infrastructure and grid connections. This is an early example of how solar is evolving from isolated projects into regional energy systems. At roughly 5.5 TWh per year, this implies a capacity factor of ~22%. It also highlights China’s ability to deploy at scale through coordination rather than a single mega-build.
3. Bhadla Solar Park, India
2.7 GW | Cluster
Bhadla held the global top spot for years and remains one of the most iconic solar developments anywhere in the world. Located in the Thar Desert, it benefits from extreme solar irradiance and vast available land. It played a critical role in pushing solar into the gigawatt era and helped establish India as a major player in global solar deployment. At around 5 TWh annually, this corresponds to a capacity factor of ~21%.
4. Huanghe Hainan Solar Park, China
2.2 GW | Cluster
This project is part of a broader hybrid energy system combining solar with hydropower. That integration allows for better balancing of generation and grid stability. At roughly 4.5 TWh per year, this implies a capacity factor of ~23%. It represents the next step beyond pure solar, where projects are designed as part of a wider energy ecosystem rather than standalone assets.
5. Al Dhafra Solar PV, UAE
2.0 GW | Single site
Al Dhafra stands out for performance as much as scale. Built using advanced bifacial panels in high-irradiance conditions, it achieves the highest capacity factor in the top 10. At roughly 4.2 TWh per year, this implies a capacity factor of ~24%. It shows what happens when optimal location meets modern solar technology. Not all gigawatts are equal.
6. Pavagada Solar Park, India
2.05 GW | Cluster
Pavagada is a landmark project in India’s solar expansion. Built across multiple villages, it demonstrates how large-scale solar can coexist with local communities. At roughly 3.8 TWh per year, this implies a capacity factor of ~21%. It also shows how policy and land aggregation models can unlock rapid deployment without requiring remote desert conditions.
7. Benban Solar Park, Egypt
1.7 GW | Cluster
Benban is one of Africa’s largest solar projects and a key milestone for the continent. It demonstrates how solar can scale in emerging markets with the right financing structures and international collaboration. At roughly 3.0 TWh per year, this implies a capacity factor of ~20%. It also highlights the role of solar in energy diversification and economic development.
8. Tengger Desert Solar Park, China
1.5 GW | Single site
Often referred to as the “Great Wall of Solar,” Tengger was one of the first truly massive solar installations. While it has been overtaken in size, it remains a symbol of early large-scale ambition. At roughly 2.75 TWh per year, this implies a capacity factor of ~21%. It helped pave the way for today’s multi-gigawatt builds.
9. Noor Abu Dhabi Solar Plant, UAE
1.2 GW | Single site
Noor Abu Dhabi was once the largest single-site solar plant globally. It played a key role in driving down solar costs through competitive bidding and scale. At roughly 2.0 TWh per year, this implies a capacity factor of ~19%. It represents the transition from early mega-projects to the even larger systems we see today.
10. Datong Solar Power Top Runner Base, China
1.05 GW | Cluster
Datong was designed as a technology showcase, incorporating advanced modules and system designs. It highlights how China has used large projects not just for generation, but also for accelerating innovation and standardisation across the industry. At roughly 1.75 TWh per year, this implies a capacity factor of ~20%.
What This Data Really Shows
The ranking itself is almost secondary.
The real signal is how fast scale is compounding.
The key signals are clear:
- China dominates with 5 of the top 10
- India is firmly established with 2 major projects
- UAE is emerging as a high-performance leader
- Africa is now on the map with Benban
- The UAE delivers the highest utilisation, with Al Dhafra at ~24% capacity factor
More importantly, 1 GW no longer stands out. It barely makes the list.
What’s Coming Next (2026 to 2028)
This is where the curve starts to steepen.
China
China is already moving beyond individual mega-projects into regional energy bases:
- Multi-gigawatt developments in Xinjiang, Qinghai, and Inner Mongolia
- Sites exceeding 5 GW under construction
- Long-term plans for 10 to 20+ GW integrated zones
India
India’s pipeline is massive but grid-limited:
- Projects like Khavda targeting tens of gigawatts
- Dozens of gigawatts waiting for transmission upgrades
- Rapid acceleration once bottlenecks clear
Middle East
The UAE and Saudi Arabia are pushing:
- 5+ GW solar projects
- Large-scale solar + storage integration
- A shift from lowest-cost power to round-the-clock energy systems
New Entrants
Countries like the Philippines and others in Southeast Asia are entering with:
- Multi-gigawatt projects
- Fast deployment timelines
The Big Picture
This is no longer a leaderboard.
It’s a moving target.
- 2 GW used to be world-leading
- 3 to 5 GW is now the new normal
- 10+ GW is already on the horizon
Solar is not just scaling. It is compounding.
Closing Thought
We are not watching the growth of a technology.
We are watching a new energy system being built in real time, one gigawatt at a time.