
What the evidence says about wind’s costs, reliability and environmental impacts.
A photograph of a dead bird cannot establish the national toll or population impact. A promotional wind-farm photo tells us no more about cost or reliability. Both need evidence behind them.
I support wind because it cuts emissions and produces electricity without an ongoing fuel bill. That support comes with expectations: protect wildlife, treat communities fairly and compare the full costs. This short guide summarises what the evidence shows, with full sources below.
Wind already delivers at scale
GWEC’s Global Wind Report 2026 records 165 GW of new wind capacity added in 2025. [1a] The global wind fleet generated 2,715 TWh that year, or 8.5% of global electricity, with the second-largest absolute generation increase behind solar. [1b]
Denmark generated 58% of its electricity from wind; the EU generated 17%. These are annual figures. [1b]
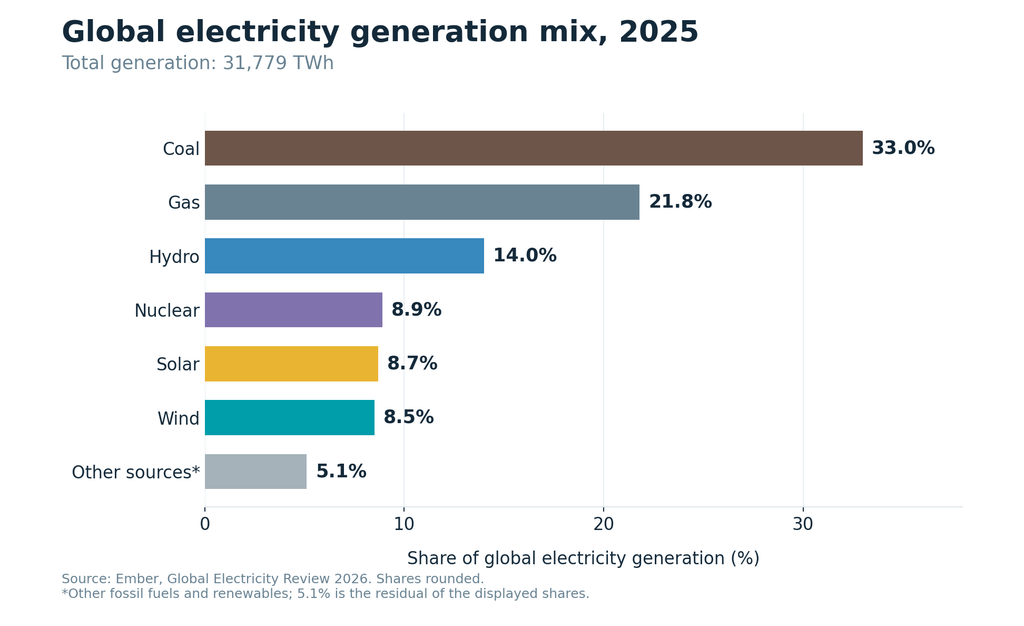
Figure 1. Global electricity mix in 2025: wind 8.5%, solar 8.7% and coal 33.0%. [1b]
China’s wind fleet generated 855.4 TWh in January–September 2026, exceeding the 785.3 TWh generated by the entire US nuclear fleet in 2025 by about 9%. That shows wind’s scale, rather than establishing equal-capacity cost or reliability. [2]
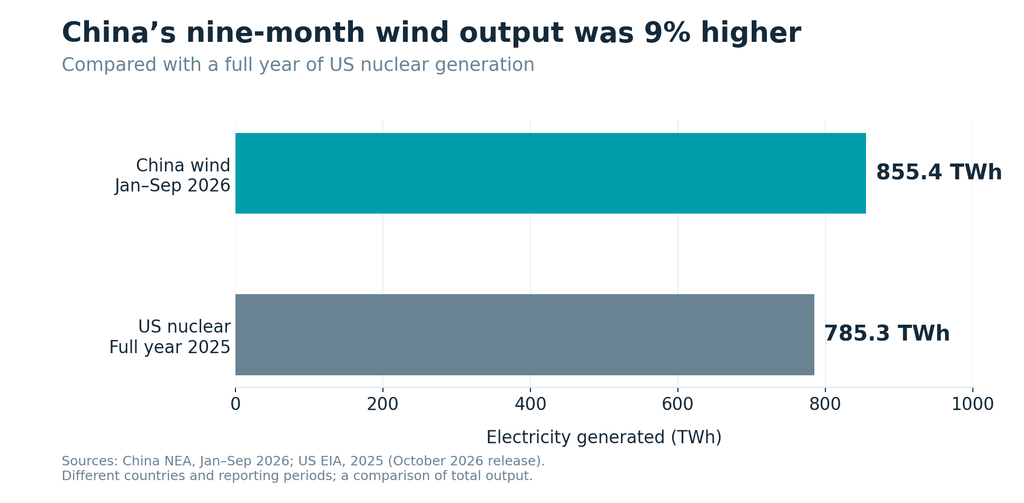
Figure 2. China wind, January–September 2026, versus US nuclear, full-year 2025: different countries and periods. [2]
Newer turbines can also do more with fewer machines. At Hagshaw Hill, Scotland, 26 turbines totalling 15.6 MW were replaced by 14 providing more than 79 MW. That is roughly five times the capacity with 46% fewer turbines. Capacity is not annual output, and larger machines still need environmental assessment. [3]
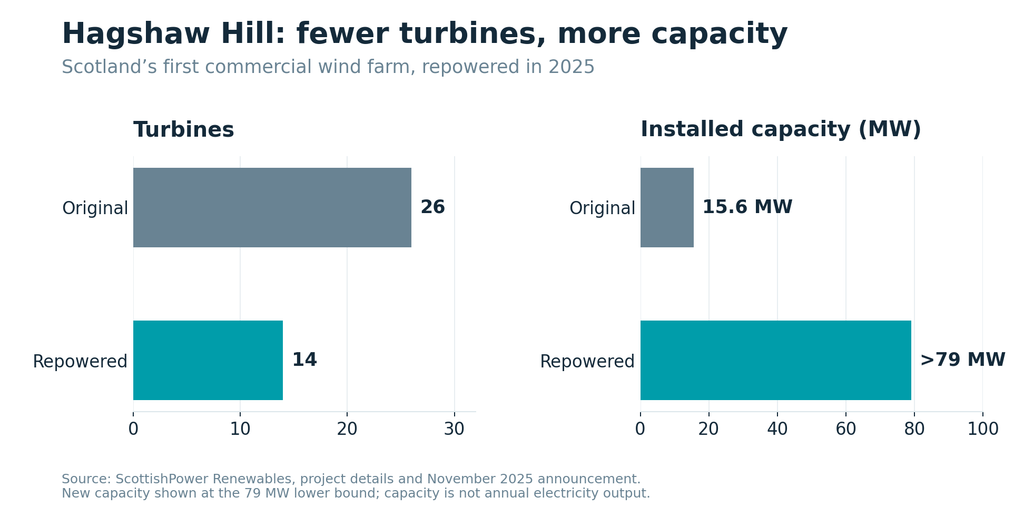
Figure 3. Hagshaw Hill: 26 turbines (15.6 MW) replaced by 14 (>79 MW). [3]
“Wind is too expensive”
Start with the cost of generating electricity. Then add the cost of supplying it when people need it.
IRENA puts average lifetime generation costs for new 2025 projects at US$33/MWh for onshore wind and US$78/MWh offshore. [4]
Reliable supply also needs networks, storage, backup and grid services. CSIRO and AEMO’s final GenCost 2025–26 includes those supporting resources in a 2050 mix with about 93% wind and solar. Its estimates are in 2025 Australian dollars: [5]
Modelled 2050 cost A$/MWh Generation and firming, excluding transmission 120–130 Generation and firming, including transmission 141–152
How much firming does 93% wind and solar need? The headline share describes annual energy; reliability is tested in the hardest hour. A backup plant can run rarely yet need to deliver substantial power during a shortfall.
In the relevant GenCost scenarios, gas supplies 3–7% of annual generation, with hydrogen replacing part under tighter emissions limits. [5]
Storage also shifts some renewable output to other hours. It is not limited to serving the remaining 7%. How much backup and storage a system needs depends on the size and length of its shortfalls.
The cost assumptions matter too. GenCost’s 2050 four-hour battery capital costs range from A$220–252/kWh, in 2025 dollars, across its technology-cost scenarios. Higher fuel or storage costs can raise system costs and change the preferred mix. [5]
That equipment-cost range does not tell us how far the system cost would move. GenCost publishes no isolated gas-price or battery-cost sensitivity test. Its A$141–152/MWh range is a conditional 2050 projection, not a complete uncertainty interval or a retail-bill forecast. [5]
The fair comparison is between complete systems meeting the same demand and reliability requirements, with construction, fuel, finance and integration costs counted for every option.
“It doesn’t work when the wind stops”
How long is the lull? Low-wind periods can last days, not just hours. [6c]
A 1 GW/4 GWh battery supplies 1 GW for about four hours before losses and reserves. Maintaining that output for two days requires 48 GWh.
That arithmetic explains why duration matters. The system combines geographically spread generation, storage, networks, flexible demand and dispatchable backup rather than asking batteries to cover every shortfall alone.
AEMO’s 2026 Integrated System Plan identifies renewables with storage, networks and gas backup as the least-cost pathway under its assumptions. [6a]
In Q3 2026, batteries supplied 8% of NEM evening-peak generation, ahead of gas at 5.1%. [6b] Planning must also cover difficult weather, equipment failures and delayed projects.
“Steel and concrete cancel out the climate benefit”
Life-cycle studies count manufacturing, construction, operation and disposal. NREL’s 2025 assessment summarises roughly 5–11 grams of greenhouse emissions per kWh for the wind systems examined, versus hundreds for gas and around a thousand for coal. Results vary, but the gap is substantial. [7]
Wind needs construction materials. Fuel-burning generation needs those materials plus a continuing supply of extracted, transported and burned fuel.
Birds and bats: real harm, with perspective
Wind turbines kill birds and bats. The species and site matter as much as the total.
The US evidence gives perspective, but combines different years and methods.
These estimates are not directly comparable and should not be read as a ranking.
| Evidence | Publication / underlying data | Estimate and scope |
|---|---|---|
| Cats | 2013 study | 1.3–4.0 billion deaths/year; historical US estimate |
| Building glass | 2024 study; rehabilitation records | Could exceed one billion deaths/year, including delayed deaths |
| Vehicles | 2024 study; 2020–2022 reports | About 96 million collisions/year; not all confirmed deaths |
| Onshore wind | OECD 2024; 2023 fleet | About 437,000–873,000 deaths/year; extrapolated rates |
| Wind monitoring | REWI 2025 synthesis; 21 years of studies | Median 1.9 birds/MW/year; study sites, not a national total |
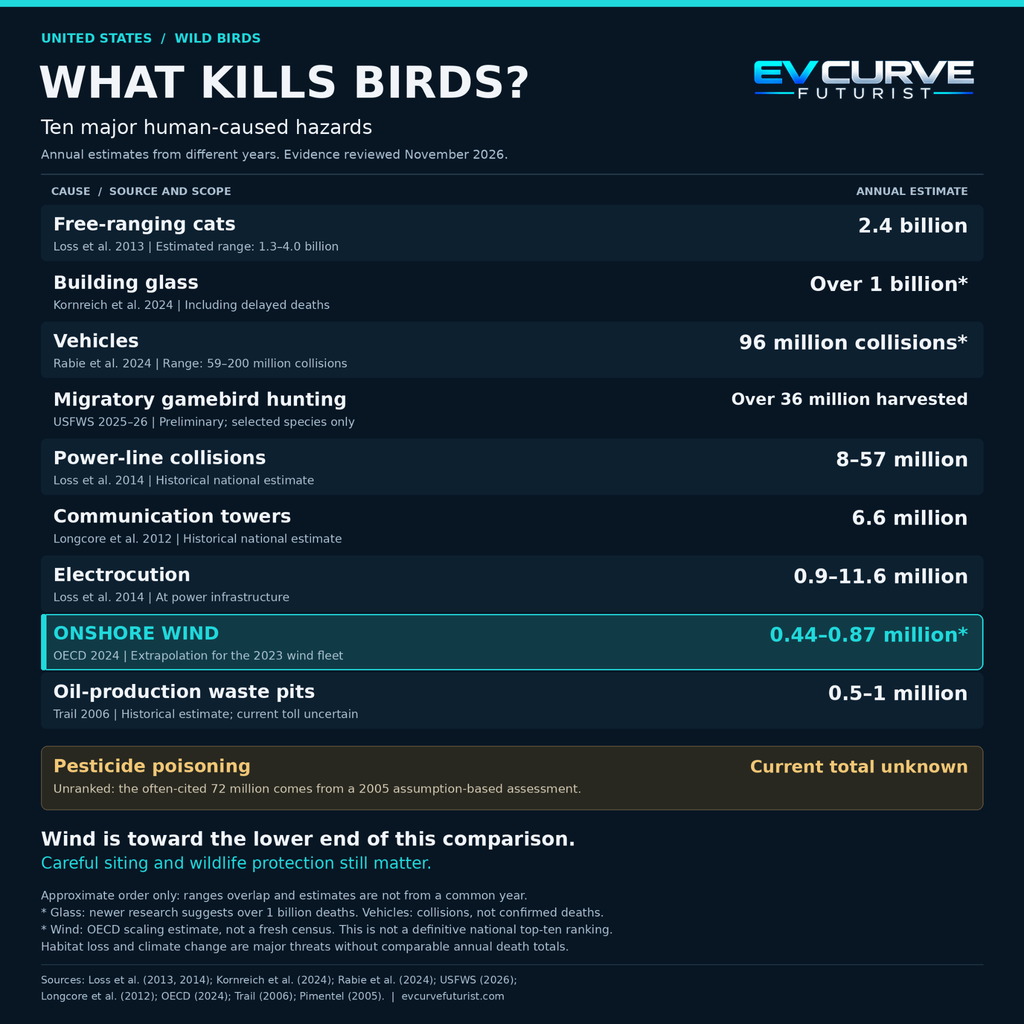
Figure 4. Selected US bird hazards: mixed years and methods, not a ranking. [8]
Offshore mortality is harder to measure, and a US national estimate remains unavailable. Unknown does not mean zero. [8]
Cats killing more birds does not excuse harm to threatened species. Better siting, monitoring and targeted shutdowns matter.
A Wyoming study estimated an 85% reduction in eagle fatalities at one facility, with wide uncertainty. [9]
A North American synthesis estimated average bat-fatality reductions of 48–61% for three studied species at a 5 m/s shutdown threshold. Those site, species and operating limits matter when applying the findings elsewhere. [10]
Offshore projects must also assess displacement from feeding grounds and altered flight routes. [11]
“Offshore wind is killing whales”
A whale death near a wind project does not, by itself, establish that the project caused it.
NOAA Fisheries reports no known links between large-whale deaths and ongoing offshore wind activities, and no scientific evidence that site-characterisation survey noise caused those deaths. Vessel strikes and fishing-gear entanglement are established threats. [12]
Construction noise and vessel traffic still need controls.
Erosion, microplastics and BPA
Blade coatings wear. A 2025 study modelled about 240 grams of microplastic emissions annually from a specified 15 MW offshore turbine, under its coating, weather and repair assumptions. That is not a universal rate. [13]
BPA exposure is a separate question. A substance’s use in manufacturing does not establish environmental exposure or harm. Inspections, durable coatings and controls on repair debris are practical safeguards.
Noise and health
Audible noise, flicker and visual intrusion deserve attention.
A 2026 study of more than 120,000 US households, using 2011–2023 data, found no detectable adverse effects at typical exposure distances on outcomes including sleep problems, anxiety and headaches. Small effects could not be excluded. [14]
A 2023 Australian controlled trial found no adverse effects on its principal sleep and other tested outcomes during 72 hours of simulated turbine infrasound. Its size and duration limit wider conclusions. [16]
A 2024 UK Health Security Agency review identified gaps beyond annoyance and sleep outcomes, alongside substantial differences in study methods. [15]
These newer studies strengthen the evidence against claims of substantial, widespread illness from turbines. Small effects and less-studied exposures remain open questions. [14–16]
Even so, noise limits, compliance checks and a workable complaints process still matter.
“The blades cannot be recycled”
The US Department of Energy puts the readily recyclable share of a turbine at 85–90% by mass, excluding foundations, underground wiring and other infrastructure. Composite blades remain harder to process. Recyclable does not mean actually recycled. [17]
At Hagshaw Hill, ScottishPower’s 2026 account reports 79.5% recycling and 20.4% reuse, or 99.9% combined, for the original turbines and associated components. The public announcement does not disclose the full inventory or calculation method, so this remains a company-reported project result. [3]
Szprotawa’s blade bridge shows how reuse can preserve a useful structure. Such projects do not replace the need for processing capacity across the retiring fleet. [18]
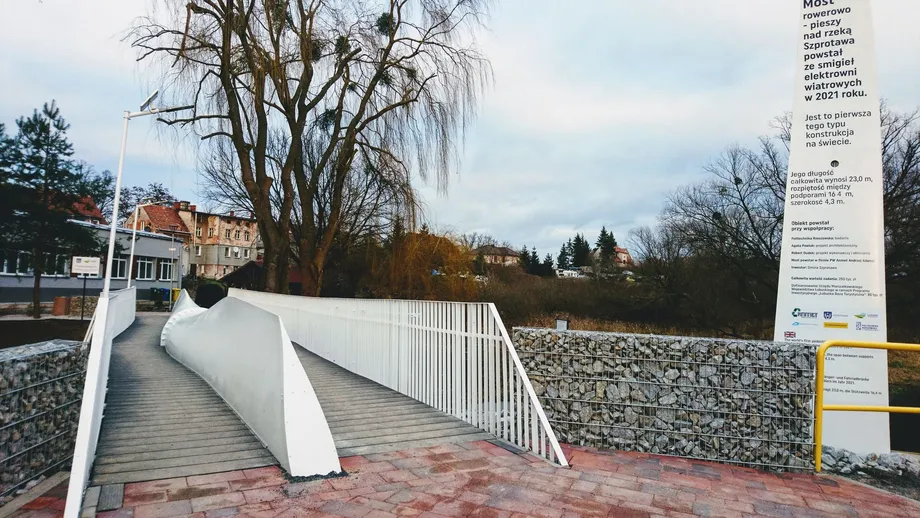
Figure 5. A turbine blade reused in a pedestrian and cycle bridge in Szprotawa, Poland. [18]
I want developers to fund decommissioning, identify credible recovery or disposal routes and commit to site restoration before construction.
Materials and supply chains
Wind’s lack of a fuel bill does not remove its exposure to imported equipment and materials.
China supplied 91% of magnet rare-earth refining and 94% of sintered permanent-magnet production in the IEA’s 2024 data. Some turbine designs use these magnets; others do not. [19]
Concentrated supply can delay construction and replacement parts. Diversification can improve security, but developing new mines and processing plants also brings environmental and social costs. [19]
Changing suppliers can improve security without improving environmental or labour practices. I favour diversification alongside traceable sourcing and stronger standards.
Communities deserve a fair say
A project can provide lease income to one property while changing the outlook from another. National benefits do not resolve that local distribution problem.
Views, heritage, tourism and noise deserve assessment alongside property values.
Visual comparisons also need to include the alternatives. I explore that argument in Wind Turbines Are Ugly. Apparently, Coal Mines Are Beautiful., which considers turbines alongside mining, fuel extraction and other energy infrastructure.
A US property study found an average 11% decline within one mile after project announcement, primarily driven by more urban counties, with effects diminishing over time. It is not an automatic discount for Australian homes. [20]
Tourism studies also vary by location, scale and method. Local assessment matters. [21]
I want consultation while choices remain open, realistic visualisations and genuine influence over project design. Benefit payments should accompany sound planning. They cannot give neighbours back a choice they were never offered.
Build carefully. Compare honestly.
Wind delivers substantial low-emission electricity without an ongoing fuel bill. Its value depends on good projects and a well-designed grid.
Birds, whales, noise and pollution deserve serious scrutiny. When a project causes harm, the response should be to document it, understand its scale and require action. Claims about that harm also need evidence that distinguishes a local finding from a wider pattern. I expect developers to substantiate their promises and critics to substantiate their claims. Neither enthusiasm for wind nor opposition to it should lower the standard of proof.
That means affordable power, lower emissions and stronger energy security, alongside wildlife protection and fair treatment of communities. Supporting wind means expecting it to meet those standards.
Selected references
Evidence reviewed 9 November 2026. Related studies are grouped below.
- Wind scale: [1a] GWEC, Global Wind Report 2026, new capacity; [1b] Ember, Global Electricity Review 2026, generation.
- China wind and US nuclear generation: China NEA; US EIA.
- Hagshaw Hill repowering and recovery: ScottishPower project; 2026 recovery account.
- Wind generation costs: IRENA, Renewable Power Generation Costs in 2025.
- Australian system costs and assumptions: GenCost 2025–26 final report.
- Australian planning and supply: [6a] AEMO ISP 2026, system pathway; [6b] AEMO Q3 2026, evening-peak generation; [6c] AEMO Winter Gas Outlook 2026, low-wind periods.
- Life-cycle emissions: NREL, Recycling Wind Energy (2025).
- US bird comparisons: Loss et al. (2013), with correction; Kornreich et al. (2024); OECD (2024); Rabie et al. (2024); REWI (2025); USFWS.
- Eagle mitigation: McClure et al. (2022).
- Bat mitigation: Whitby et al. (2024).
- Offshore birds: Reid and Baker (2025).
- Whales: NOAA Fisheries.
- Blade erosion: Caboni et al. (2025).
- US household health study: Rott et al. (2026).
- UK health evidence review: Woodland et al. (2024).
- Australian infrasound trial: Marshall et al. (2023).
- Turbine recyclability: US Department of Energy guide.
- Blade bridge: Szprotawa municipality.
- Mineral supply chains and generator designs: IEA, Rare Earth Elements (2026); US DOE magnet assessment (2022).
- Property values: Brunner et al. (2023).
- Tourism: Gallegati et al. (2026); Castellani et al. (2026 working paper).